

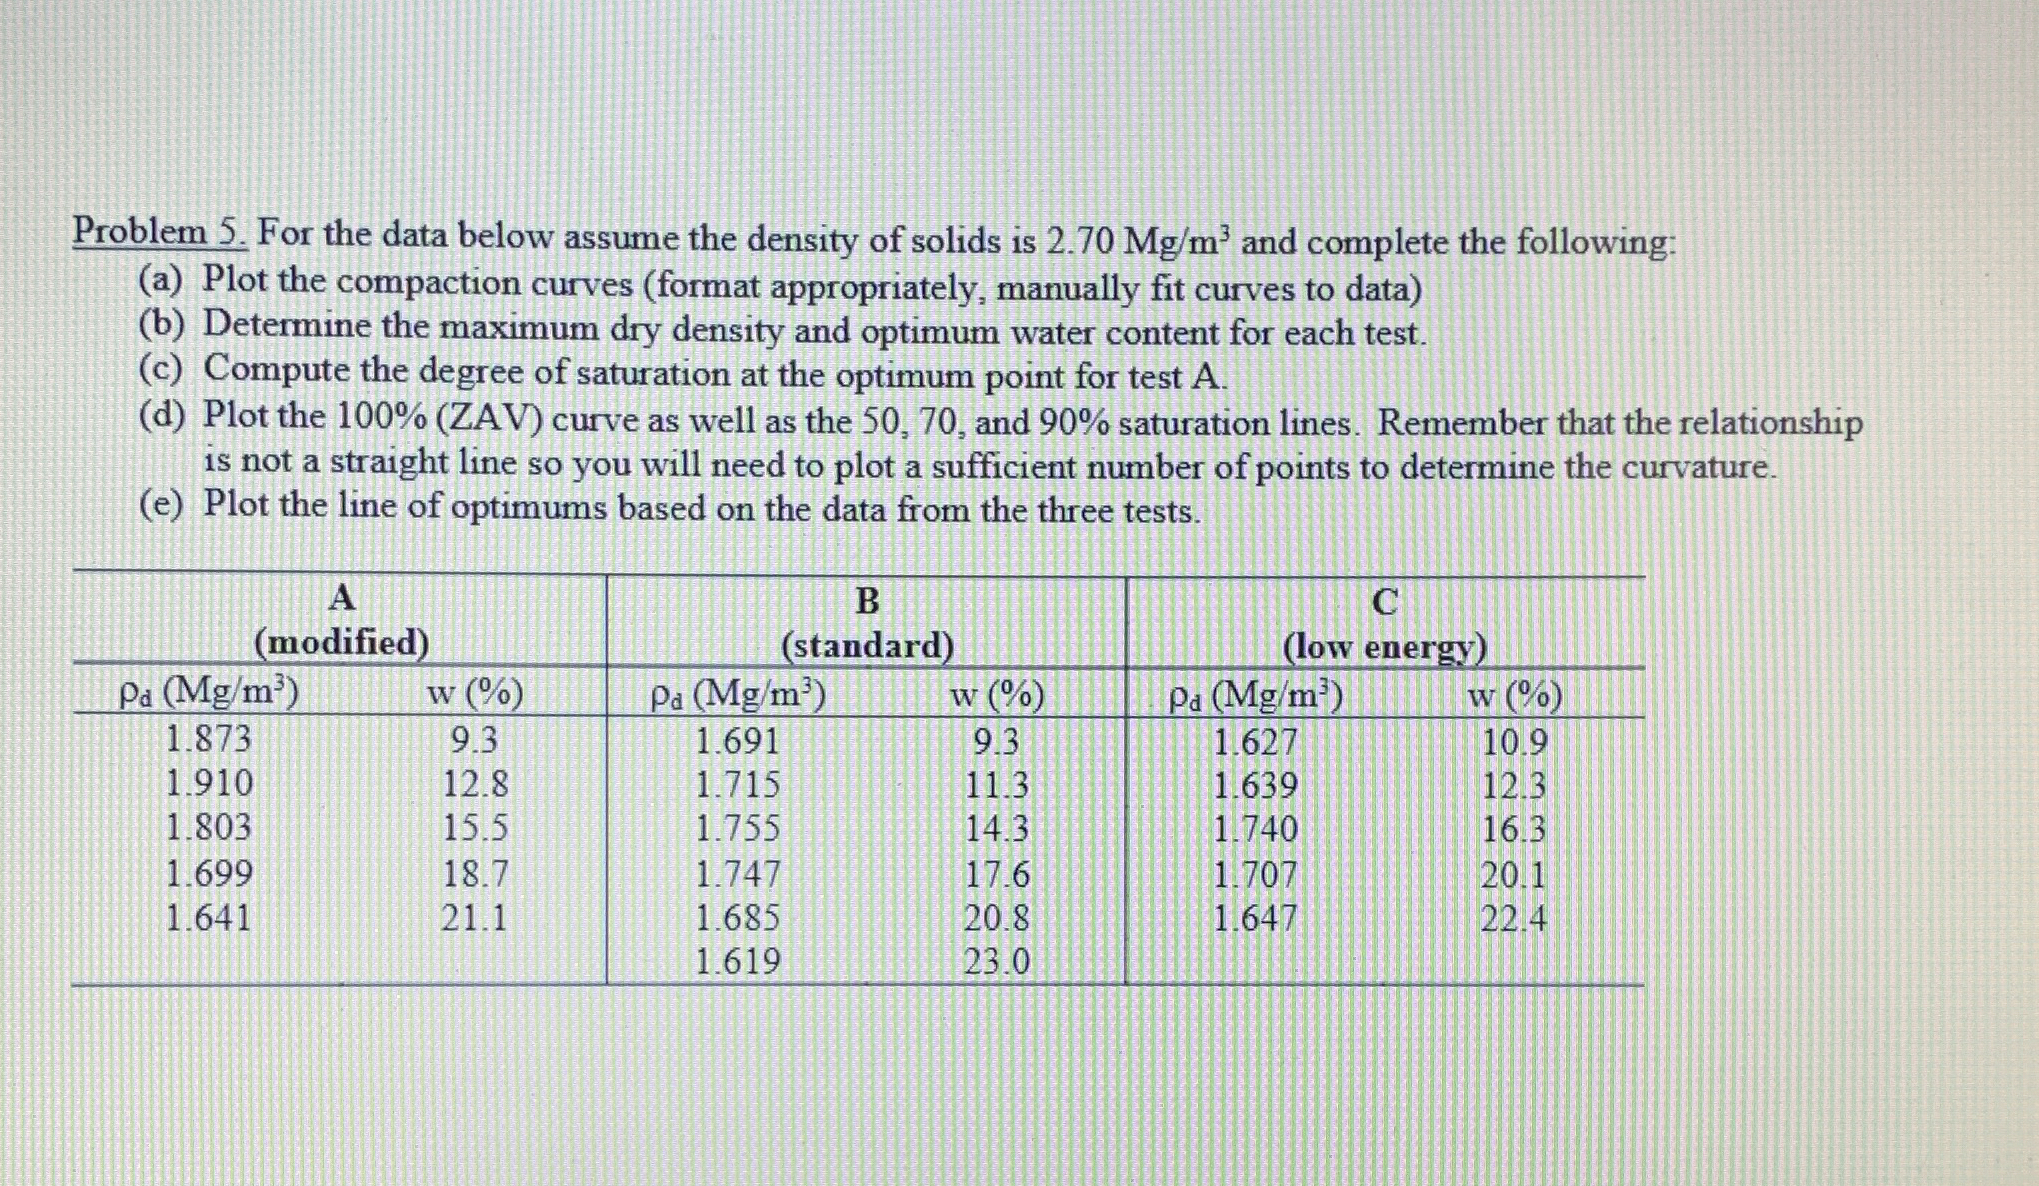
Question: Problem 5 . For the data below assume the density of solids is 2 . 7 0 M g m 3 and complete the following:
Problem For the data below assume the density of solids is and complete the following:
a Plot the compaction curves format appropriately, manually fit curves to data
b Determine the maximum dry density and optimum water content for each test.
c Compute the degree of saturation at the optimum point for test
d Plot the ZAV curve as well as the and saturation lines. Remember that the relationship is not a straight line so you will need to plot a sufficient number of points to determine the curvature.
e Plot the line of optimums based on the data from the three tests.
table
tableClow energyw w w
Step by Step Solution
There are 3 Steps involved in it
1 Expert Approved Answer
Step: 1 Unlock

Question Has Been Solved by an Expert!
Get step-by-step solutions from verified subject matter experts
Step: 2 Unlock
Step: 3 Unlock