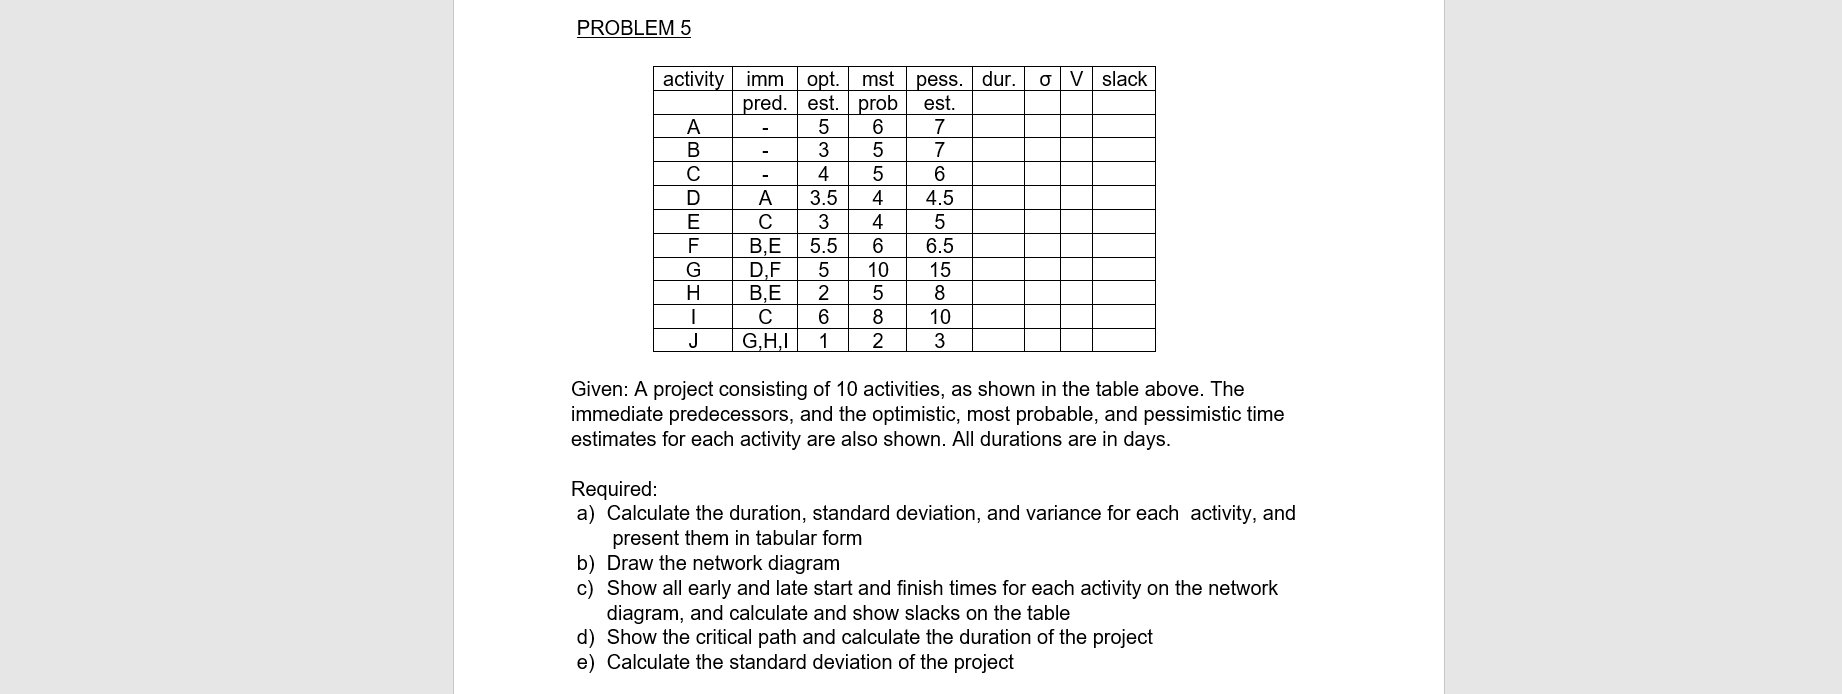
Question: PROBLEM 5 opt. o V slack pess. dur. est. 7 activity imm pred. A B D A E F BE G D,F H B.E J

PROBLEM 5 opt. o V slack pess. dur. est. 7

PROBLEM 5 opt. o V slack pess. dur. est. 7 activity imm pred. A B D A E F BE G D,F H B.E J GHI mst est. prob 5 6 3 5 4 5 3.5 4 3 4 5.5 6 5 10 2 5 6 8 2 les 1 6 4.5 5 6.5 15 8 10 3 - 1 Given: A project consisting of 10 activities, as shown in the table above. The immediate predecessors, and the optimistic, most probable, and pessimistic time estimates for each activity are also shown. All durations are in days. Required: a) Calculate the duration, standard deviation, and variance for each activity, and present them in tabular form b) Draw the network diagram c) Show all early and late start and finish times for each activity on the network diagram, and calculate and show slacks on the table d) Show the critical path and calculate the duration of the project e) Calculate the standard deviation of the project

Step by Step Solution

There are 3 Steps involved in it

1 Expert Approved Answer
Step: 1 Unlock blur-text-image
Question Has Been Solved by an Expert!

Get step-by-step solutions from verified subject matter experts

Step: 2 Unlock
Step: 3 Unlock

Students Have Also Explored These Related General Management Questions!