

Question: Problem #5: Suppose this information is available for PepsiCo, Inc. for 2015, 2016, and 2017. In millions Beginning Inventory Ending Inventory Cost of Goods Sold
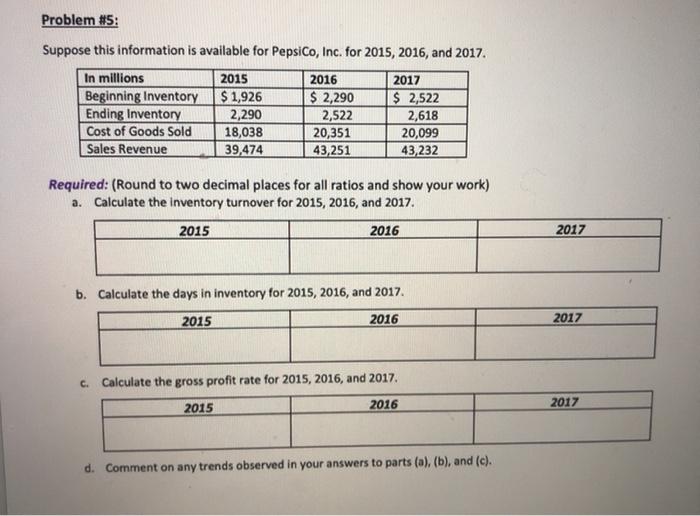
Problem #5: Suppose this information is available for PepsiCo, Inc. for 2015, 2016, and 2017. In millions Beginning Inventory Ending Inventory Cost of Goods Sold Sales Revenue 2015 $ 1,926 2,290 18,038 39,474 2016 $ 2,290 2,522 20,351 43,251 2017 $ 2,522 2,618 20,099 43,232 Required: (Round to two decimal places for all ratios and show your work) a. Calculate the inventory turnover for 2015, 2016, and 2017. 2015 2016 2017 b. Calculate the days in inventory for 2015, 2016, and 2017 2015 2016 2017 c. Calculate the gross profit rate for 2015, 2016, and 2017 2015 2016 2017 d. Comment on any trends observed in your answers to parts (a), (b), and (c)
Step by Step Solution
There are 3 Steps involved in it

Get step-by-step solutions from verified subject matter experts