

Question: CALCULATOR FULL SCREEN PRINTE Suppose this information is available for PepsiCo, Inc. for 2015, 2016, and 2017 in millions) Beginning inventony Ending inventory Cost of
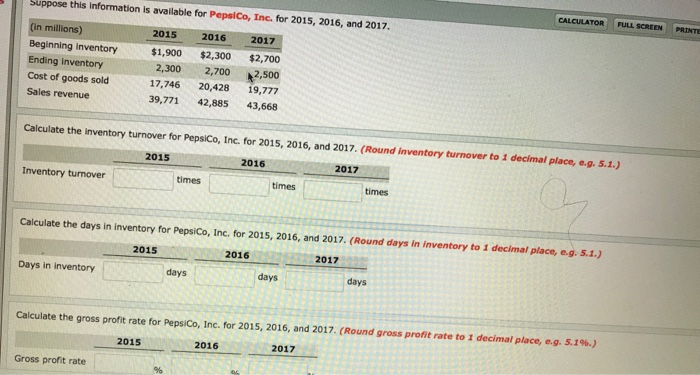
CALCULATOR FULL SCREEN PRINTE Suppose this information is available for PepsiCo, Inc. for 2015, 2016, and 2017 in millions) Beginning inventony Ending inventory Cost of goods sold Sales revenue 2015 2016 2017 $1,900 $2,300 $2,700 2,300 2,700 2,500 17,746 20,428 19,777 39,771 42,885 43,668 Calculate the inventory turnover for Pepsico, Inc. for 2015, 2016, and 2017. (Round inventory turnover to 1 decimal place, o.g. 5.1.) 2015 2016 2017 Inventory turnover times times times Calculate the days in inventory for Pepsico, Inc. for 2015, 2016, and 2017. (Round days in inventory to 1 declmal place, e.g. s.1.) 2015 2016 2017 Days in inventory days days days Calculate the gross profit rate for PepsiCo, Inc. for 2015, 2016, and 2017. (Round gross profit rate to 1 decimal place, eg, s.1%.) 2015 2016 2017 Gross profit rate
Step by Step Solution
There are 3 Steps involved in it

Get step-by-step solutions from verified subject matter experts