

Question: PROBLEM #5 The tables below provide information on the relationship between the price of a product and either the quantity supplied by producers, or the

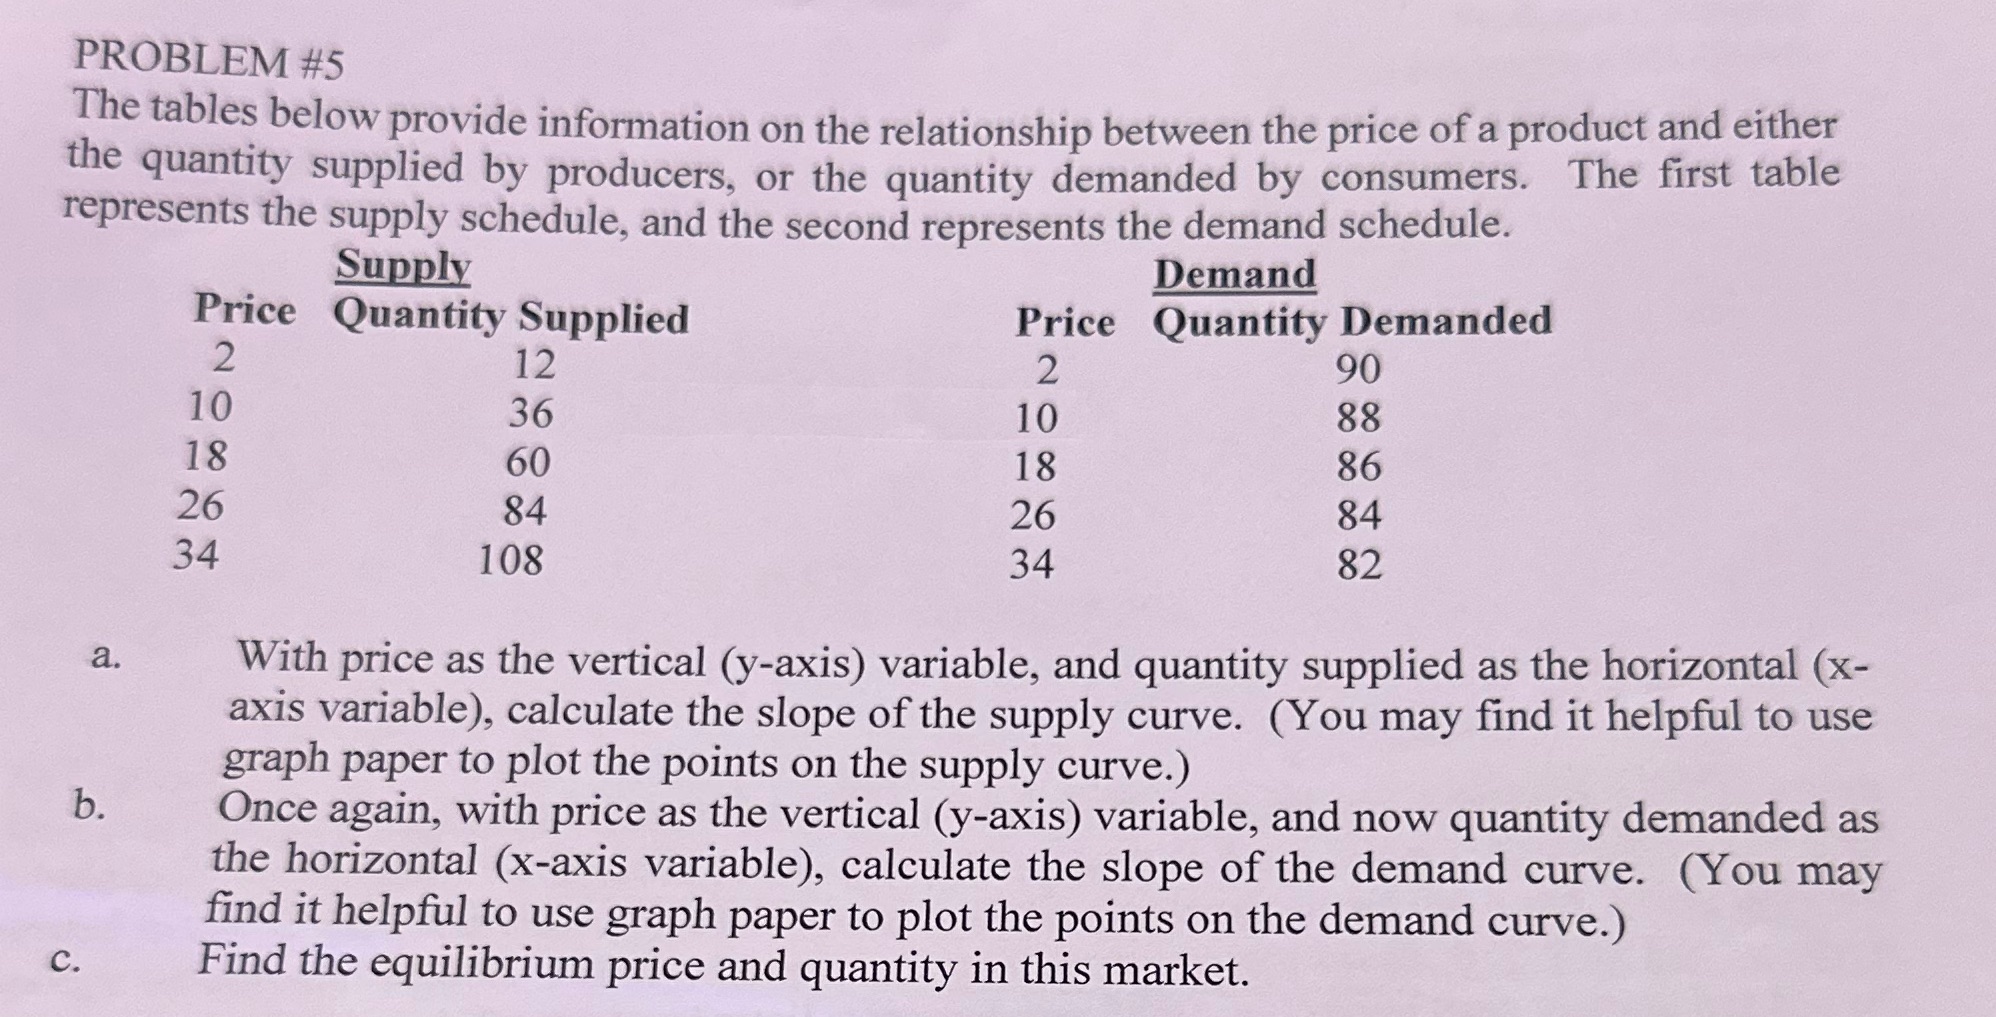
PROBLEM #5 The tables below provide information on the relationship between the price of a product and either the quantity supplied by producers, or the quantity demanded by consumers. The first table represents the supply schedule, and the second represents the demand schedule. Supply Demand Price Quantity Supplied Price Quantity Demanded 2 12 2 90 10 36 10 88 18 60 18 86 26 84 26 84 34 108 34 82 a. With price as the vertical (y-axis) variable, and quantity supplied as the horizontal (x- axis variable), calculate the slope of the supply curve. (You may find it helpful to use graph paper to plot the points on the supply curve.) b. Once again, with price as the vertical (y-axis) variable, and now quantity demanded as the horizontal (x-axis variable), calculate the slope of the demand curve. (You may find it helpful to use graph paper to plot the points on the demand curve.) C. Find the equilibrium price and quantity in this market
Step by Step Solution
There are 3 Steps involved in it

Get step-by-step solutions from verified subject matter experts