

Question: --------------------------------- Problem 50E: Chapter: CH3 Problem: 50E In a university where calculus is a prerequisite for the statistics course, a sample of 15 students was
---------------------------------
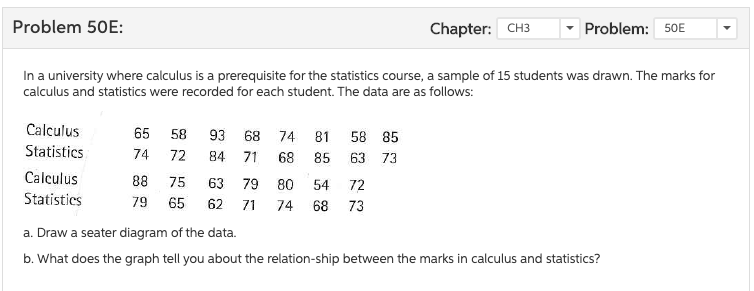
Problem 50E: Chapter: CH3 Problem: 50E In a university where calculus is a prerequisite for the statistics course, a sample of 15 students was drawn. The marks for calculus and statistics were recorded for each student. The data are as follows: Calculus 65 58 93 68 74 81 58 85 Statistics 74 72 84 71 68 85 63 73 Calculus 88 75 63 79 80 54 72 Statistics 79 65 62 71 74 68 73 a. Draw a seater diagram of the data. b. What does the graph tell you about the relation-ship between the marks in calculus and statistics
Step by Step Solution
There are 3 Steps involved in it
1 Expert Approved Answer
Step: 1 Unlock

Question Has Been Solved by an Expert!
Get step-by-step solutions from verified subject matter experts
Step: 2 Unlock
Step: 3 Unlock