

Question: Problem 5-11 Using historical risk premiums from Table 5.5 over the 1927-2018 period as your guide, what would be your estimate of the expected annual
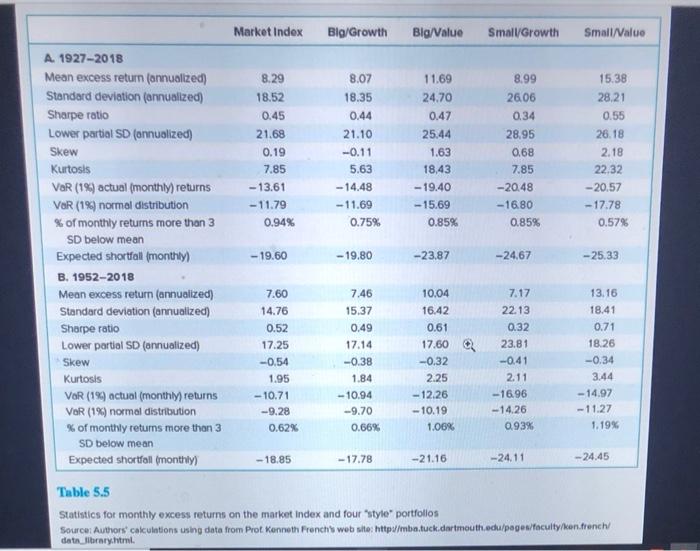
Problem 5-11 Using historical risk premiums from Table 5.5 over the 1927-2018 period as your guide, what would be your estimate of the expected annual HPR on the Big Value portfolio if the current risk-free interest rate is 2.45%? (Round your answer to 2 decimal places.) Expected trial HPR Market Index Big/Growth Big/Value Small Growth Small/Value 8.29 18.52 0.45 21.68 0.19 7.85 - 13.61 -11.79 0.94% 8.07 18.35 0.44 21.10 -0.11 5.63 - 14.48 11.69 24.70 0.47 25.44 1.63 18,43 -19.40 - 15.69 0.85% 8.99 26.06 0.34 28.95 0.68 7.85 -20.48 -16.80 0.85% 15.38 28.21 0.55 26.18 2.18 22.32 -20.57 -17.78 0.57% -11.69 0.75% - 19.60 - 19.80 -23.87 -24.67 A. 1927-2018 Mean excess return (annualized) Standard deviation (annualized) Sharpe ratio Lower partial SD (annualized) Skew Kurtosis VaR (19) actual (monthly) returns VaR (19) normal distribution % of monthly returns more than 3 SD below mean Expected shortfall (monthly B. 1952-2018 Mean excess return (annualized) Standard deviation (annualized) Sharpe ratio Lower partial SD (annualized) Skew Kurtosis VaR (19) actual (monthly) returns VOR (1%) normal distribution % of monthly returns more than 3 SD below mean Expected shortfall (monthly) - 25.33 7.60 14.76 0.52 17.25 -0.54 1.95 -10.71 -9.28 0.62% 7.46 15.37 0.49 17.14 -0.38 1.84 -10.94 -9.70 0.66% 10.04 16.42 0.61 17.60 -0.32 2.25 - 12.26 -10.19 1.06% 7.17 22.13 0.32 23.81 -0.41 2.11 -16.96 -14.26 0.93% 13.16 18.41 0.71 18.26 -0.34 3.44 - 14.97 - 11.27 1.19% -18.85 -17.78 -21.16 -24.11 - 24.45 Table 5.5 Statistics for monthly excess returns on the market Index and four style portfolios Source: Authors' calculations using data from Prot Kenneth French's website: https//mba.tuck.dartmouth.edu/pages/faculty/ken.french data Jibrary.html
Step by Step Solution
There are 3 Steps involved in it

Get step-by-step solutions from verified subject matter experts