

Question: Problem 5.3 Table 5.8 gives the oscillatory shear flow data obtained using a cone-and-plat rheometer for an LDPE. (a) Prepare logG versus log and logG
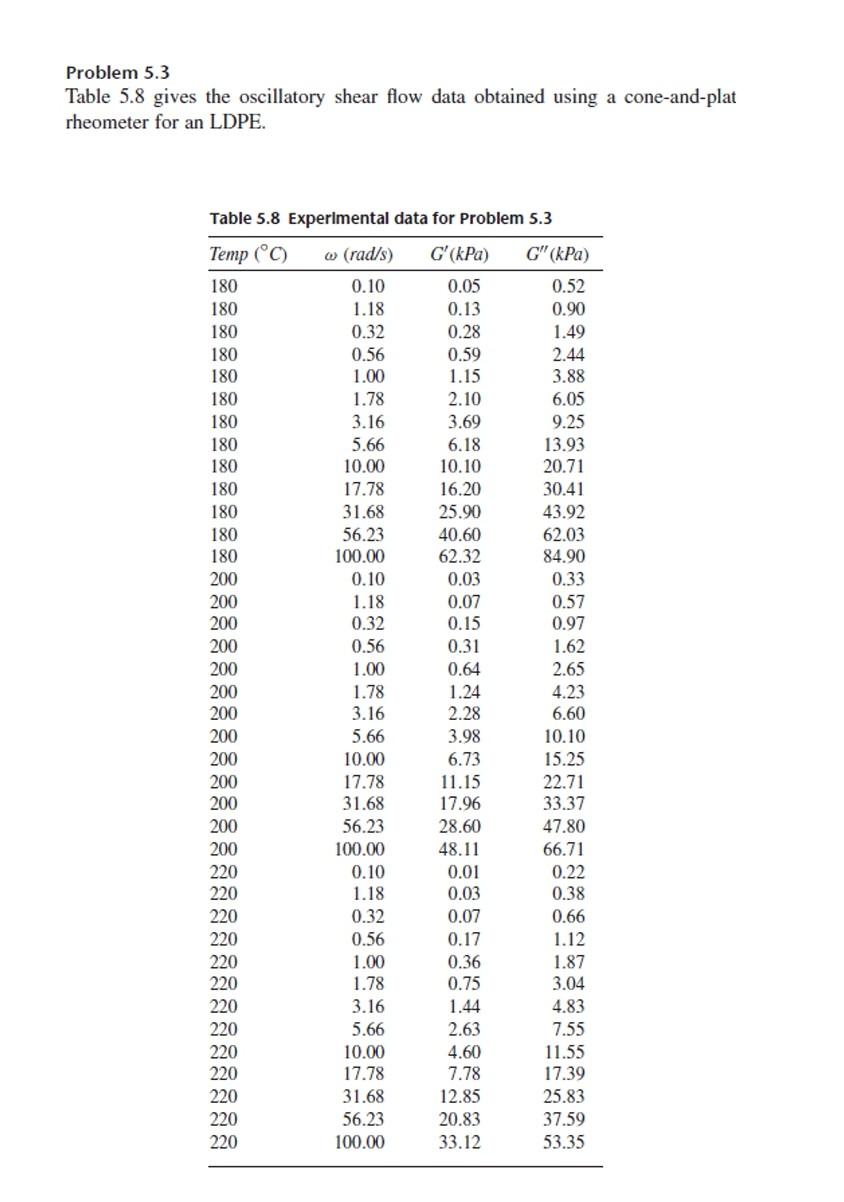
Problem 5.3 Table 5.8 gives the oscillatory shear flow data obtained using a cone-and-plat rheometer for an LDPE. (a) Prepare logG versus log and logG versus log plots for each temperature. You will observe temperature dependence of the plots. (b) Prepare a logG versus logG plot for each temperature. You will observe that the plots are virtually independent of temperature. Give physical reason(s) for such an observation
Step by Step Solution
There are 3 Steps involved in it
1 Expert Approved Answer
Step: 1 Unlock

Question Has Been Solved by an Expert!
Get step-by-step solutions from verified subject matter experts
Step: 2 Unlock
Step: 3 Unlock