Question: Problem 5-35. Can you please do it step by step in excel? per hour from the plant to the city using this network? Vs Figure

Problem 5-35. Can you please do it step by step in excel?Problem 5-35. Can you please do it step by step

per hour from the plant to the city using this network? Vs Figure 5.37: Network for Problem 5-34 Figure 5.38: Network for Problem 5-35 5-35. The network in Figure 5.38 shows the pipeline transportation system for treated water from the treatment plant (node 1) to a city water supply system (node 14). The arc capacities represent millions of gallons per hour. How much water can be transported 5-36. In Problem 5-35, two of the terminals in the water supply network (see Figure 5.38), represented by nodes 10 and 11, are to be

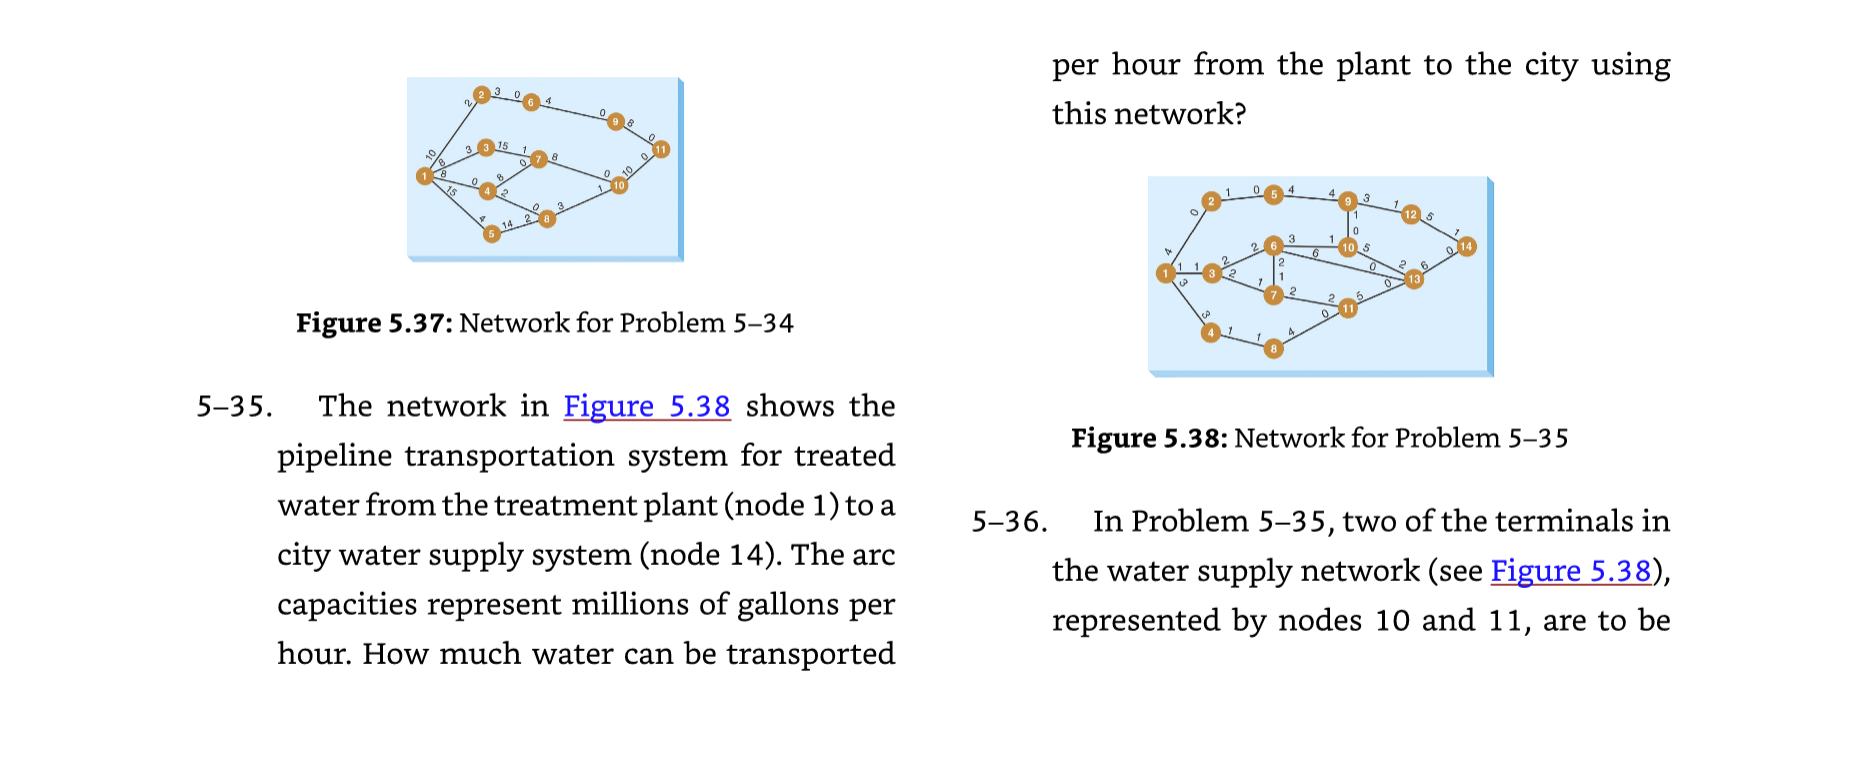
Step by Step Solution

There are 3 Steps involved in it

1 Expert Approved Answer
Step: 1 Unlock blur-text-image
Question Has Been Solved by an Expert!

Get step-by-step solutions from verified subject matter experts

Step: 2 Unlock
Step: 3 Unlock

Students Have Also Explored These Related General Management Questions!