

Question: Problem 6: Consider the three graphs in Figure 7.1, which depict three situations in which a farm household might find itself. a. What assumptions are
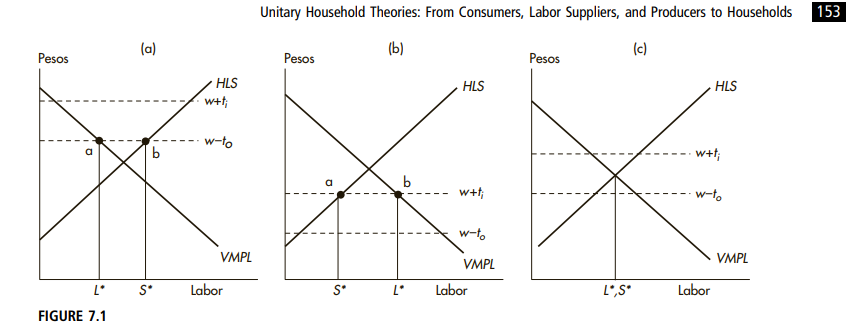
Problem 6: Consider the three graphs in Figure 7.1, which depict three situations in which a farm household might find itself. a. What assumptions are common to the three situations? b. What assumptions differ across the three situations? c. What does the HLS schedule represent? What would happen to the HLS schedule in any panel if the household's nonlabor income endowment (M) increased? Explain. Unitary Household Theories: From Consumers, Labor Suppliers, and Producers to Households 153 (a) (b) (c) Pesos Pesos Pesos HLS w+t HLS HLS w-to b w+t a b W+ w-to w-to VMPL VMPL VMPL S* Labor S* L Labor L",S* Labor L* FIGURE 7.1 d. Analyze what would happen in each of the three panels to the utility-maximizing levels of S*, L*, and Q*, and to the household's sales and purchases of labor, as a result of the increase in the household's nonlabor income endowment (M). Problem 6: Consider the three graphs in Figure 7.1, which depict three situations in which a farm household might find itself. a. What assumptions are common to the three situations? b. What assumptions differ across the three situations? c. What does the HLS schedule represent? What would happen to the HLS schedule in any panel if the household's nonlabor income endowment (M) increased? Explain. Unitary Household Theories: From Consumers, Labor Suppliers, and Producers to Households 153 (a) (b) (c) Pesos Pesos Pesos HLS w+t HLS HLS w-to b w+t a b W+ w-to w-to VMPL VMPL VMPL S* Labor S* L Labor L",S* Labor L* FIGURE 7.1 d. Analyze what would happen in each of the three panels to the utility-maximizing levels of S*, L*, and Q*, and to the household's sales and purchases of labor, as a result of the increase in the household's nonlabor income endowment (M)
Step by Step Solution
There are 3 Steps involved in it

Get step-by-step solutions from verified subject matter experts