

Question: Problem 6 Plot the grain size distribution curves using Excel. For each classification, you must show all steps required to justify the classification selected. c
Problem Plot the grain size distribution curves using Excel. For each classification, you must
show all steps required to justify the classification selected.
c For Soil : The insitu water content was determined to be What is the
liquidity index for this soil? What does this LI tell you about the relative strength of
the soil in the current state insitu water content What is the Activity of this soil?
Do you expect that this soil has the tendency to swell based on the Activity?
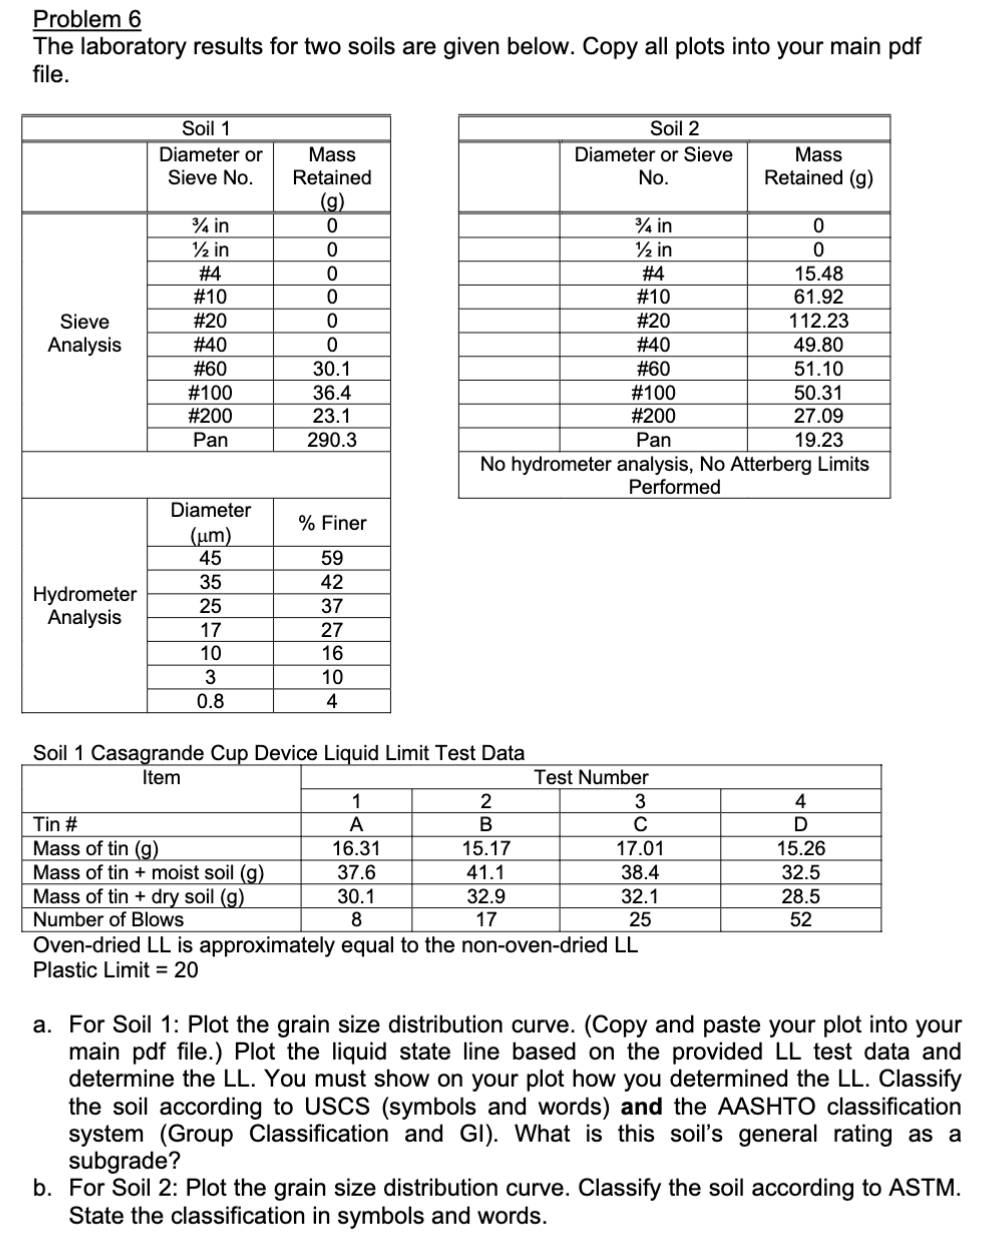
The laboratory results for two soils are given below. Copy all plots into your main pdf
file.
Soil Casagrande Cup Device Liquid Limit Test Data
Ovendried LL is approximately equal to the nonovendried LL
Plastic Limit
a For Soil : Plot the grain size distribution curve. Copy and paste your plot into your
main pdf file. Plot the liquid state line based on the provided LL test data and
determine the LL You must show on your plot how you determined the LL Classify
the soil according to USCS symbols and words and the AASHTO classification
system Group Classification and GI What is this soil's general rating as a
subgrade?
b For Soil : Plot the grain size distribution curve. Classify the soil according to ASTM.
State the classification in symbols and words.
Step by Step Solution
There are 3 Steps involved in it
1 Expert Approved Answer
Step: 1 Unlock

Question Has Been Solved by an Expert!
Get step-by-step solutions from verified subject matter experts
Step: 2 Unlock
Step: 3 Unlock