

Question: Problem 6. (Python, 20 points) Suppose that text file visc.txt stores absolute temperature and corresponding follows: dynamic viscosity measurements for water. The contents of the
Problem 6. (Python, 20 points) Suppose that text file visc.txt stores absolute temperature and corresponding follows: dynamic viscosity measurements for water. The contents of the file look as Dynamic viscosity measurement Temperature (deg C) Viscosity (10^(-3) N*s/m) O 1 . 787 5 1 . 519 LO 1. 307 20 1 . 002 30 0. 7975 40 0. 6529 50 0 . 6007 Write a Python script to do the following: a) Open the file for reading. b) Perform operations necessary to ignore the text portion of the file and store the numerical portion of the file in vectors T and visc. c) Using the temperature T you read from the file, estimate viscosity with Andrade's model with coefficients A=1.7658 and B=3.1456 as follows: B m = A e T+273.15 d) Plot a graph showing viscosity visc vs. temperature T from the file using red circles (o). On the same graph, compare this data with the estimate m in part c), and use blue solid line for the model. Make sure to annotate axes of the graph as well as provide legend for the data and the model prediction
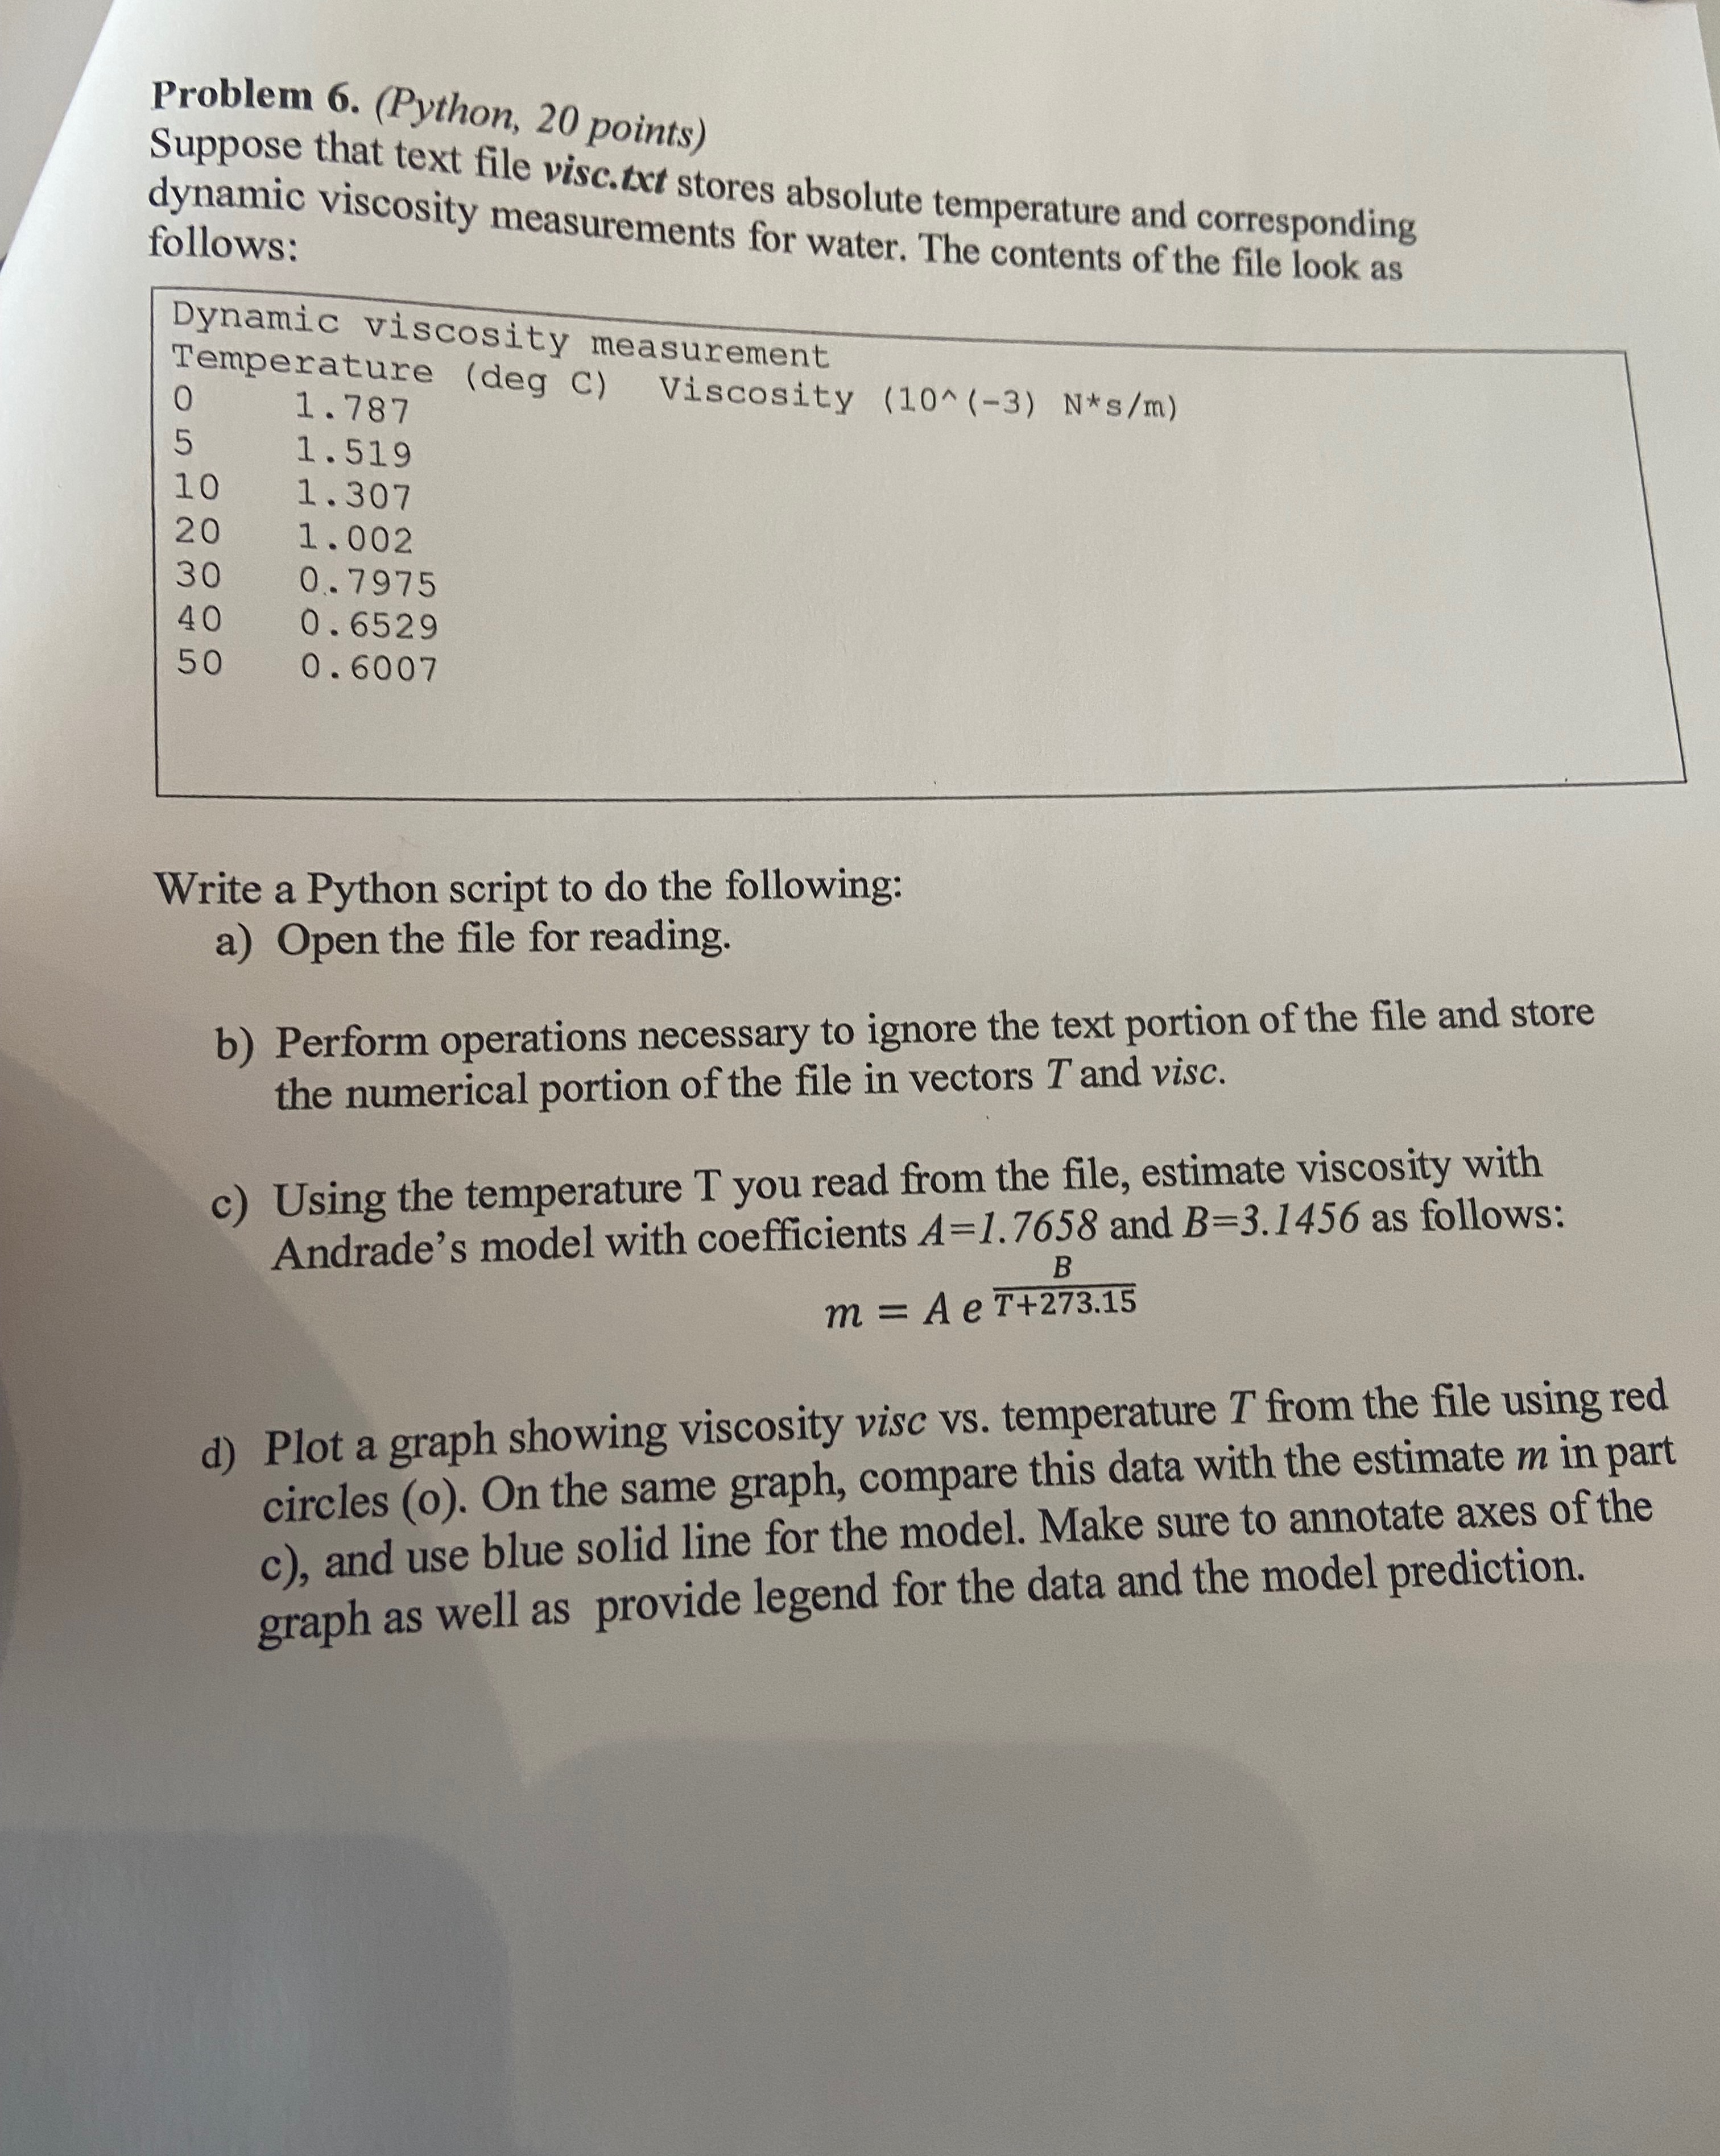
Problem 6. (Python, 20 points) Suppose that text file visc.txt stores absolute temperature and corresponding dynamic viscosity measurements for water. The contents of the file look as follows: Dynamic viscosity measurement Temperature (deg C) Viscosity (10^ (-3) N*s/m) 0 512 1.787 1.519 10 1.307 20 1.002 30 0.7975 40 0.6529 50 0.6007 Write a Python script to do the following: a) Open the file for reading. b) Perform operations necessary to ignore the text portion of the file and store the numerical portion of the file in vectors T and visc. c) Using the temperature T you read from the file, estimate viscosity with Andrade's model with coefficients A=1.7658 and B-3.1456 as follows: B m = A e T+273.15 d) Plot a graph showing viscosity visc vs. temperature T from the file using red circles (o). On the same graph, compare this data with the estimate m in part c), and use blue solid line for the model. Make sure to annotate axes of the graph as well as provide legend for the data and the model prediction.
Step by Step Solution
There are 3 Steps involved in it

Get step-by-step solutions from verified subject matter experts