

Question: Problem 6: The marginal and average cost curves facing a firm are drawn in the following diagram. No-trade Trade Price Price AC AC MC MC
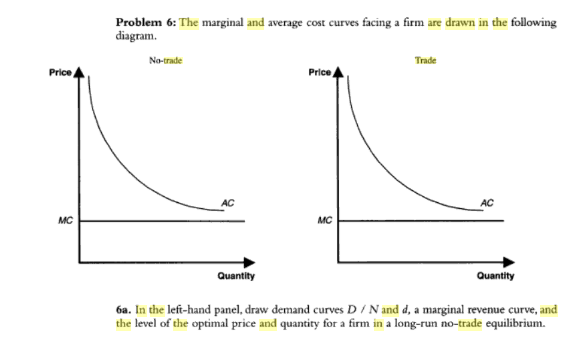
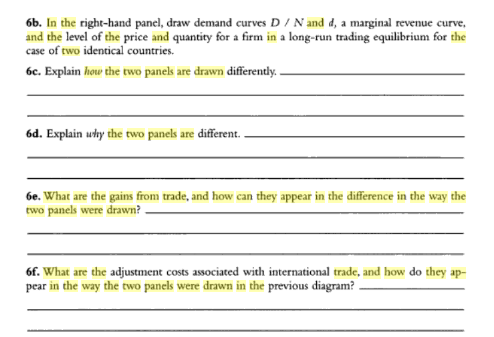
Problem 6: The marginal and average cost curves facing a firm are drawn in the following diagram. No-trade Trade Price Price AC AC MC MC Quantity Quantity 6a. In the left-hand panel, draw demand curves D / N and d, a marginal revenue curve, and the level of the optimal price and quantity for a firm in a long-run no-trade equilibrium.6b. In the right-hand panel, draw demand curves D / N and d, a marginal revenue curve, and the level of the price and quantity for a firm in a long-run trading equilibrium for the case of two identical countries. 6c. Explain how the two panels are drawn differently. 6d. Explain why the two panels are different. Ge. What are the gains from trade, and how can they appear in the difference in the way the two panels were drawn? of. What are the adjustment costs associated with international trade, and how do they ap- pear in the way the two panels were drawn in the previous diagram
Step by Step Solution
There are 3 Steps involved in it

Get step-by-step solutions from verified subject matter experts