

Question: Problem 6-10 Consider historical data showing that the average annual rate of return on the S&P 500 portfolio over the past 85 years has averaged
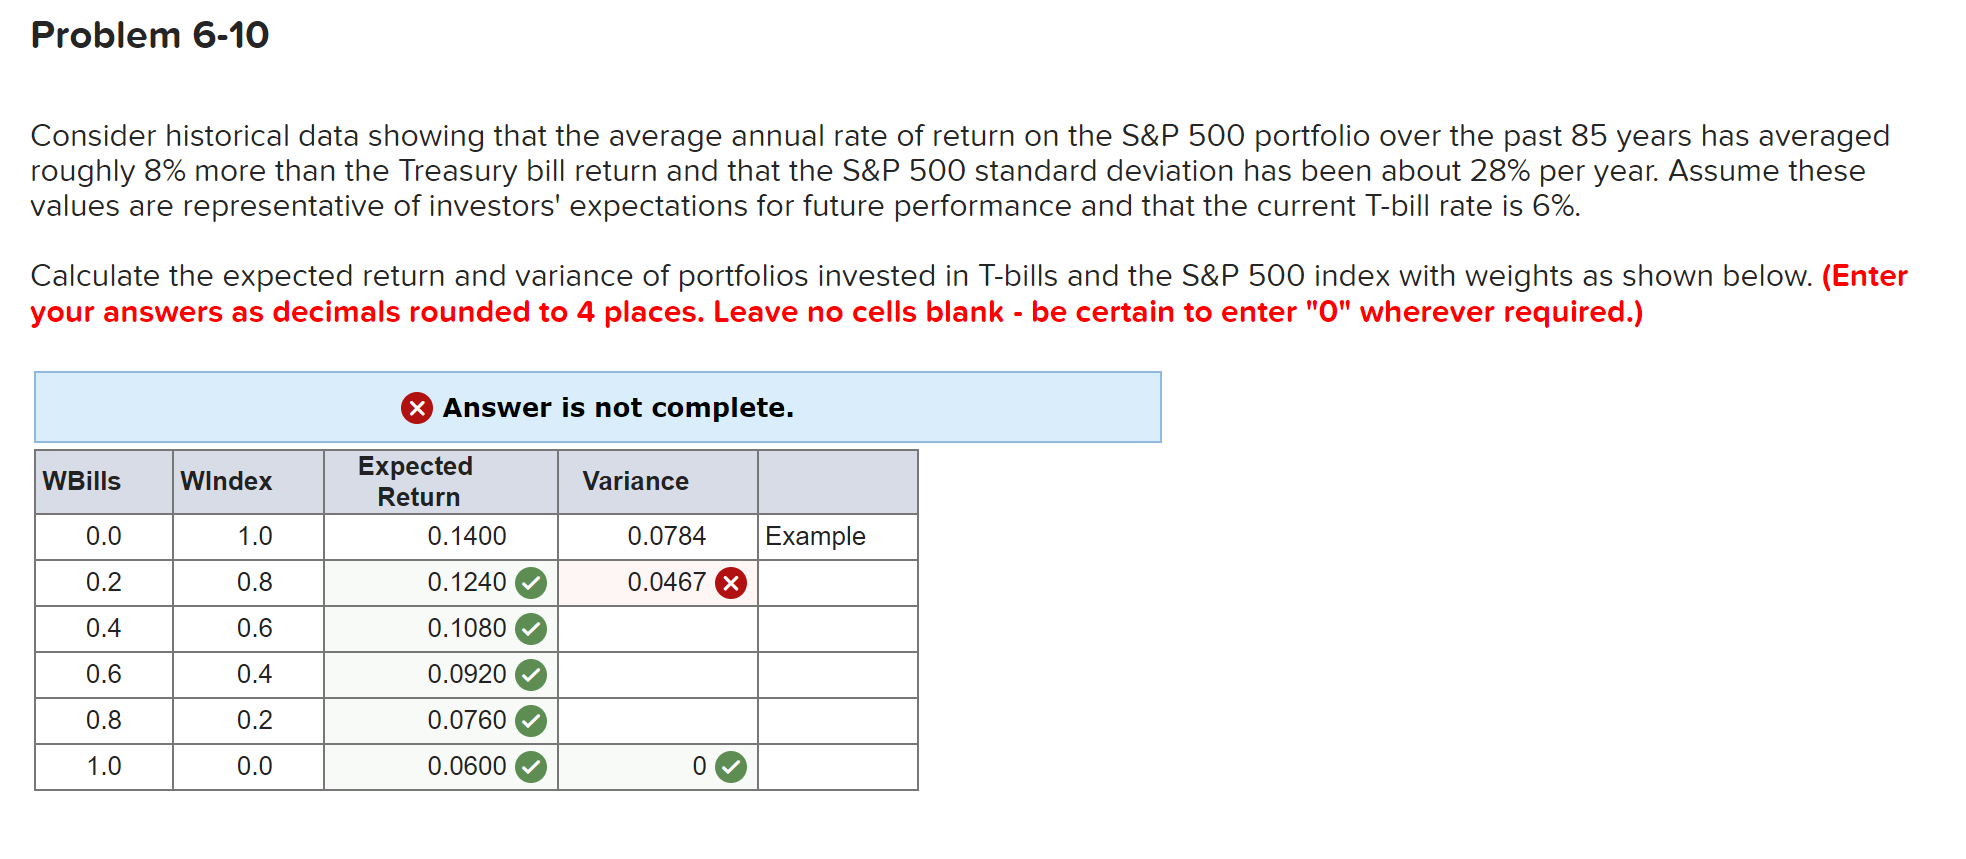
Problem 6-10 Consider historical data showing that the average annual rate of return on the S&P 500 portfolio over the past 85 years has averaged roughly 8% more than the Treasury bill return and that the S&P 500 standard deviation has been about 28% per year. Assume these values are representative of investors' expectations for future performance and that the current T-bill rate is 6%. Calculate the expected return and variance of portfolios invested in T-bills and the S&P 500 index with weights as shown below. (Enter your answers as decimals rounded to 4 places. Leave no cells blank - be certain to enter "O" wherever required.) X Answer is not complete. WBills Windex Expected Return Variance 0.0 1.0 0.1400 0.0784 Example 0.2 0.8 0.1240 0.0467 X 0.4 0.6 0.1080 0.6 0.4 0.0920 0.8 0.2 0.0760 1.0 0.0 0.0600 0
Step by Step Solution
There are 3 Steps involved in it

Get step-by-step solutions from verified subject matter experts