

Question: This problem corresponds to problems 1 0 and 1 1 in Chapter 6 Problem Set. Consider historical data showing that the average annual rate of
This problem corresponds to problems and in Chapter Problem Set.
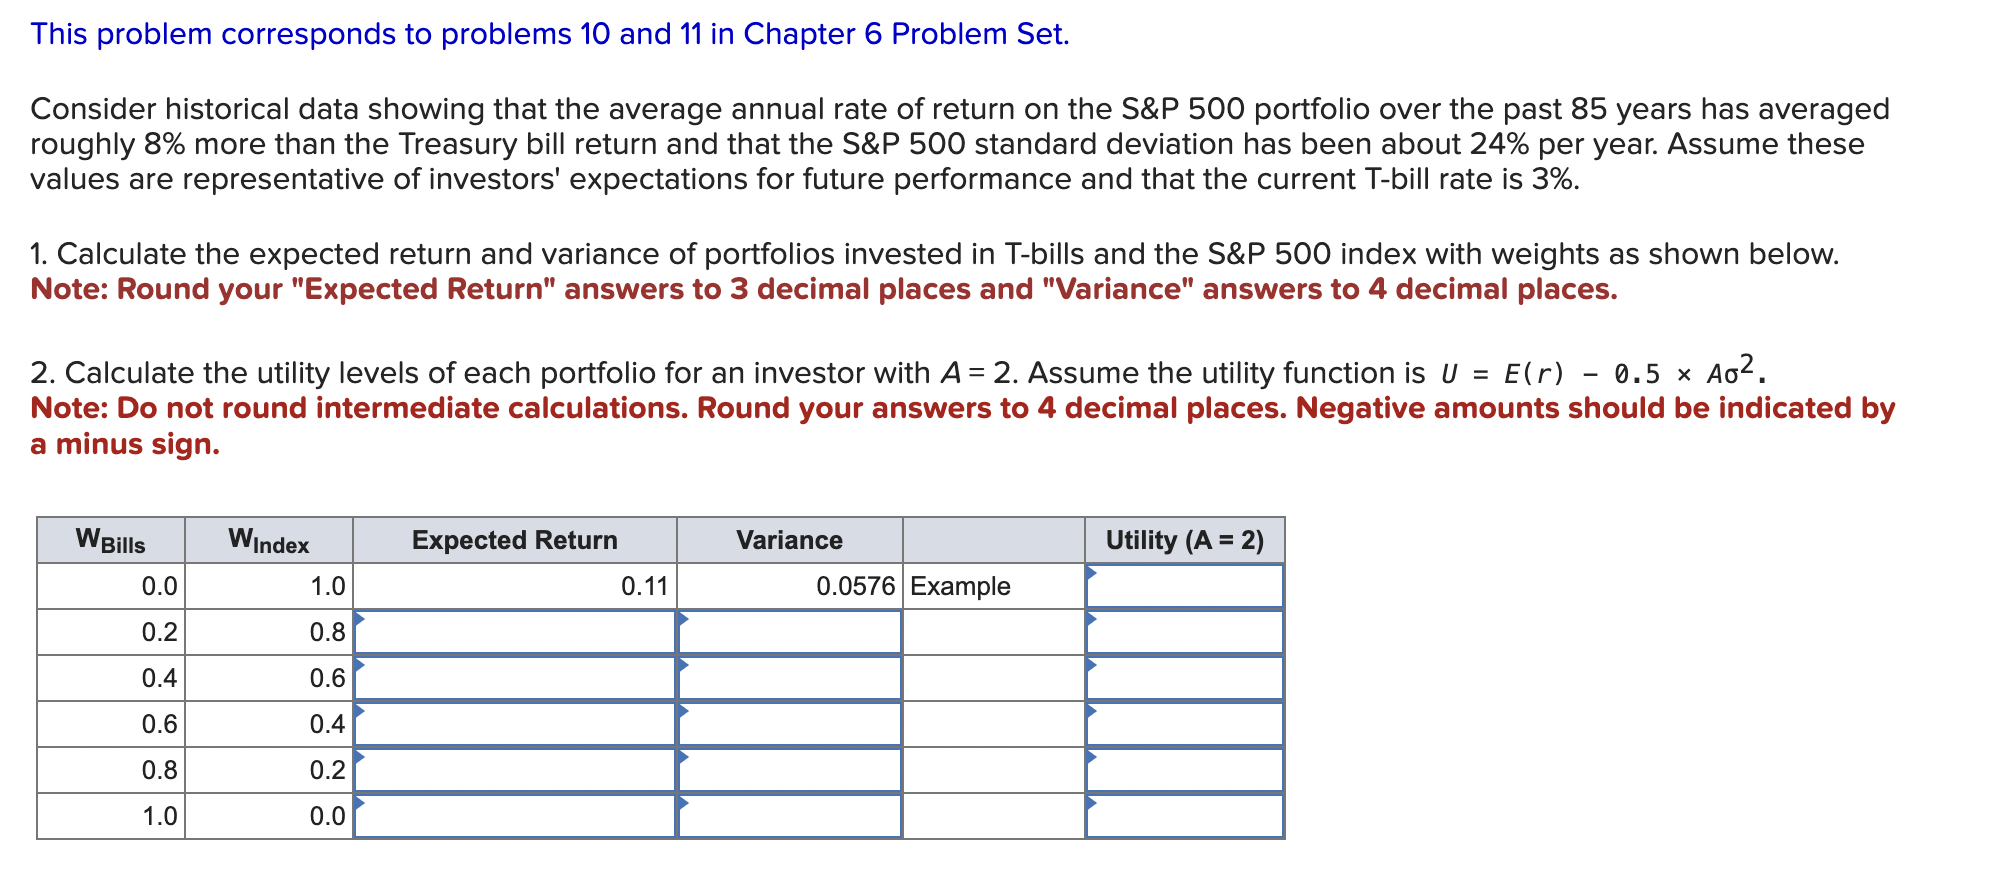
Consider historical data showing that the average annual rate of return on the S&P portfolio over the past years has averaged roughly more than the Treasury bill return and that the S&P standard deviation has been about per year. Assume these values are representative of investors' expectations for future performance and that the current Tbill rate is
Calculate the expected return and variance of portfolios invested in Tbills and the S&P index with weights as shown below. Note: Round your "Expected Return" answers to decimal places and "Variance" answers to decimal places.
Calculate the utility levels of each portfolio for an investor with A Assume the utility function is UErtimes A sigma Note: Do not round intermediate calculations. Round your answers to decimal places. Negative amounts should be indicated by a minus sign.
Step by Step Solution
There are 3 Steps involved in it
1 Expert Approved Answer
Step: 1 Unlock

Question Has Been Solved by an Expert!
Get step-by-step solutions from verified subject matter experts
Step: 2 Unlock
Step: 3 Unlock