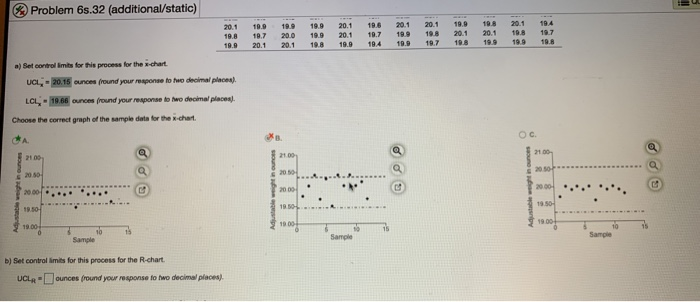
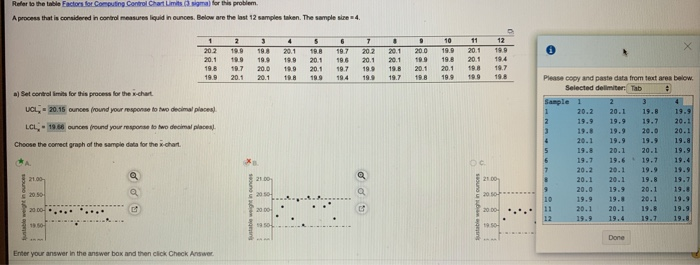
Question: Problem 68.32 (additional/static) 20.1 198 10.9 10.0 107 20.1 10 9 200 20.1 199 199 108 20.1 20.1 109 10.6 10.7 104 20.1 199 109

Problem 68.32 (additional/static) 20.1 198 10.9
Problem 68.32 (additional/static) 20.1 198 10.9 10.0 107 20.1 10 9 200 20.1 199 199 108 20.1 20.1 109 10.6 10.7 104 20.1 199 109 20. 1 198 197 19.9 20.1 198 10.8 20.1 199 20. 1 10.8 100 194 10.7 10.8 a) Set controllimits for this process for the chart. UCL, -20.15 ounces fround your response to the decimal places). LCL - 19.66 ounces fround your response to two decimal placeal. Choose the correct graph of the sample data for the x-chat D) Set control limits for this process for the R-chart UCL- ounces fround your response to two decimal places). Refer to the table Factors for Computing Control Charts for a problem A process that is considered in control measures liquid in ounces. Below are the last 12 samples taken. The sample size=4 9 10 11 12 19.9 20.1 20.1 TB 199 194 195 197 198 199 09 19.8 Please copy and paste data from textares below. Selected delimiter: Tab a) Set control for this process for the chart UCL - 20.15 ounces fround your response to two decimal places LCL - 19.66 ounces fround your response to two decimal places. 20.2 19.9 19.8 20.1 19.8 19.7 20.1 19.9 19.9 19.9 20.1 19.6 19.8 19.7 20.0 19.9 20.1 19.7 19.9 20.1 20.1 19.8 19.9 19.4 Choose the correct graph of the sample data for the x-chart 20. 220. 119. 9 9 20. 1 20.0 19.9 20.1 2 0.1 19.9 19.8 20.1 19.8 20.1 20.1 19.8 19.7 19.3 19.9 19.9 answer in the answer box and then click Check

Step by Step Solution

There are 3 Steps involved in it

1 Expert Approved Answer
Step: 1 Unlock blur-text-image
Question Has Been Solved by an Expert!

Get step-by-step solutions from verified subject matter experts

Step: 2 Unlock
Step: 3 Unlock

Students Have Also Explored These Related General Management Questions!