

Question: Problem 7 (16 Points) You will need to know how to use the Excel graphing function to complete this problem. If you do not know
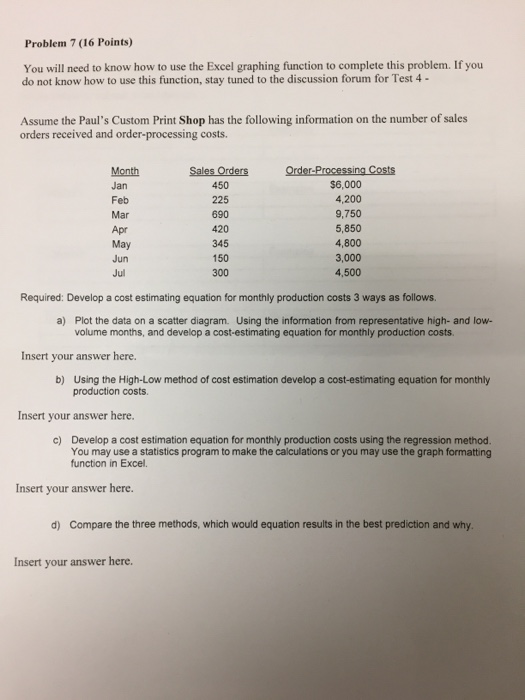
Problem 7 (16 Points) You will need to know how to use the Excel graphing function to complete this problem. If you do not know how to use this function, stay tuned to the discussion forum for Test 4- Assume the Paul's Custom Print Shop has the following information on the number of sales orders received and order-processing costs Month Jan Feb Mar Apr May Jun Jul 450 225 690 420 345 150 300 $6,000 4,200 9,750 5,850 4,800 3,000 4,500 Required: Develop a cost estimating equation for monthly production costs 3 ways as follows. a) Plot the data on a scatter diagram. Using the information from representative high- and low volume months, and develop a cost-estimating equation for monthly production costs. Insert your answer here. b) Using the High-Low method of cost estimation develop a cost-estimating equation for monthly production costs. Insert your answer here. Develop a cost estimation equation for monthly production costs using the regression method. You may use a statistics program to make the calculations or you may use the graph formatting function in Excel. c) Insert your answer here. d) Compare the three methods, which would equation results in the best prediction and why Insert your answer here
Step by Step Solution
There are 3 Steps involved in it

Get step-by-step solutions from verified subject matter experts