

Question: PROBLEM 8-5 Given Solution Legend Financial Information (Millions Revenues EBITDA Net Income Eamings per Share Interest Bearing Debt Common Equity Total Assets O'Reill Advance Auto
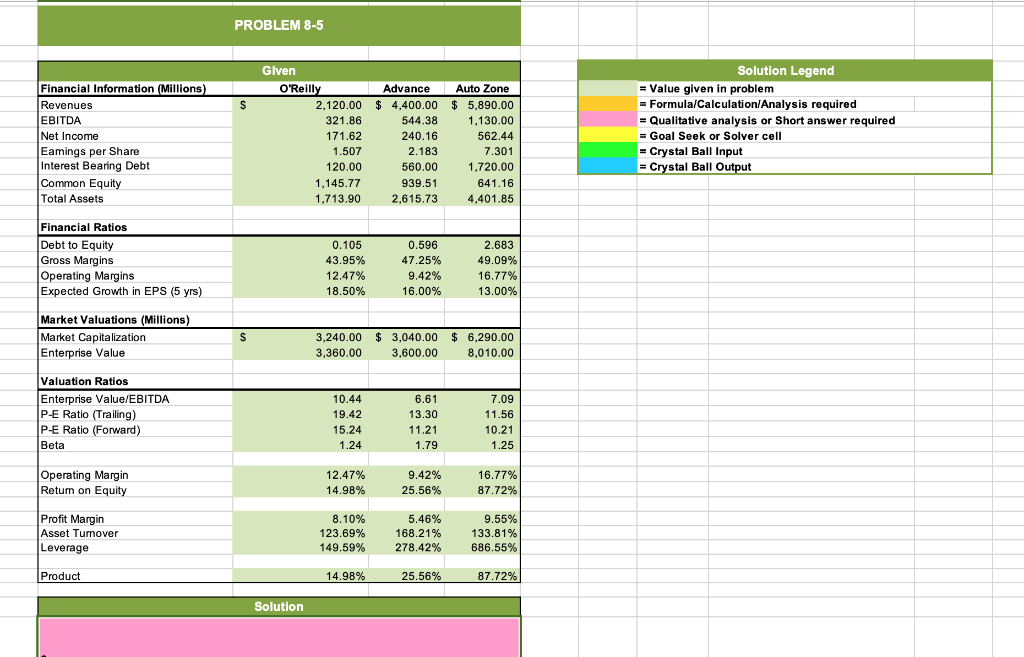
PROBLEM 8-5 Given Solution Legend Financial Information (Millions Revenues EBITDA Net Income Eamings per Share Interest Bearing Debt Common Equity Total Assets O'Reill Advance Auto Zone 2,120.00 $ 4,400.00 $5,890.00 1,130.00 562.44 7.301 1,720.00 641.16 4,401.85 321.86 171.62 1.507 120.00 1,145.77 1,713.90 544.38 240.16 2.183 560.00 939.51 2,615.73 Value given in problem Formula/Calculation/Analysis required Qualitative analysis or Short answer required Goal Seek or Solver cell Crystal Ball Input Crystal Ball O Financial Ratios Debt to Equity Gross Margins Operating Margins Expected Growth in EPS (5 yrs) 0.105 43.95% 12.47% 18.50% 0.596 47.25% 9.42% 16.00% 2.683 49.09% 16.77% 13.00% Market Valuations (Millions) Market Capitalization Enterprise Value 3,240.00 3,040.00 $ 6,290.00 3,360.00 3,600.00 8,010.00 Valuation Ratios Enterprise Value/EBITDA P-E Ratio (Trailing) P-E Ratio (Forward) 10.44 19.42 15.24 1.24 6.61 13.30 7.09 11.56 10.21 1.25 Operating Margin Retum on Equity 12.47% 14.98% 9.42% 25.56% 16.77% 87.72% Profit Margin Asset Tumover Leverage 8.10% 123.69% 149.59% 5.46% 168.21% 278.42% 9.55% 133.81% 686.55% Product 14.98 25.56% 87 72% Solution a. How would you use this information to evaluate a potential offer to acquire Carquest's equity? b. What do you think is driving the rather dramatic differences in the valuation ratios of the three firms? PROBLEM 8-5 Given Solution Legend Financial Information (Millions Revenues EBITDA Net Income Eamings per Share Interest Bearing Debt Common Equity Total Assets O'Reill Advance Auto Zone 2,120.00 $ 4,400.00 $5,890.00 1,130.00 562.44 7.301 1,720.00 641.16 4,401.85 321.86 171.62 1.507 120.00 1,145.77 1,713.90 544.38 240.16 2.183 560.00 939.51 2,615.73 Value given in problem Formula/Calculation/Analysis required Qualitative analysis or Short answer required Goal Seek or Solver cell Crystal Ball Input Crystal Ball O Financial Ratios Debt to Equity Gross Margins Operating Margins Expected Growth in EPS (5 yrs) 0.105 43.95% 12.47% 18.50% 0.596 47.25% 9.42% 16.00% 2.683 49.09% 16.77% 13.00% Market Valuations (Millions) Market Capitalization Enterprise Value 3,240.00 3,040.00 $ 6,290.00 3,360.00 3,600.00 8,010.00 Valuation Ratios Enterprise Value/EBITDA P-E Ratio (Trailing) P-E Ratio (Forward) 10.44 19.42 15.24 1.24 6.61 13.30 7.09 11.56 10.21 1.25 Operating Margin Retum on Equity 12.47% 14.98% 9.42% 25.56% 16.77% 87.72% Profit Margin Asset Tumover Leverage 8.10% 123.69% 149.59% 5.46% 168.21% 278.42% 9.55% 133.81% 686.55% Product 14.98 25.56% 87 72% Solution a. How would you use this information to evaluate a potential offer to acquire Carquest's equity? b. What do you think is driving the rather dramatic differences in the valuation ratios of the three firms
Step by Step Solution
There are 3 Steps involved in it

Get step-by-step solutions from verified subject matter experts