

Question: PROBLEM A: Use the following to answer questions 14 - 16: A quality analyst wants to construct a sample mean chart for controlling a packaging
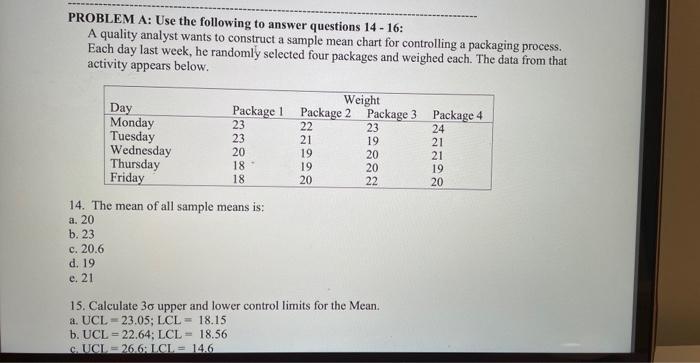
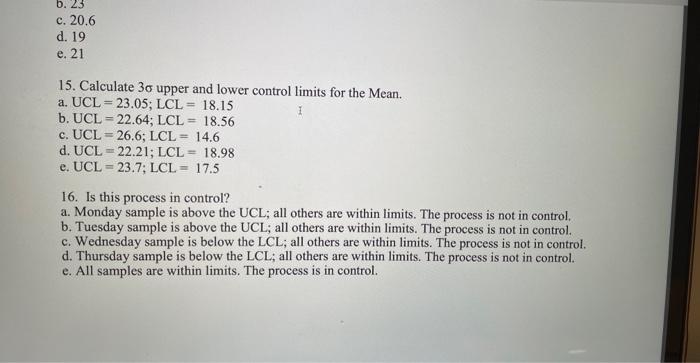
PROBLEM A: Use the following to answer questions 14 - 16: A quality analyst wants to construct a sample mean chart for controlling a packaging process. Each day last week, he randomly selected four packages and weighed each. The data from that activity appears below. Day Monday Tuesday Wednesday Thursday Friday Package 1 23 23 20 18 18 14. The mean of all sample means is: a. 20 b. 23 c. 20.6 d. 19 e. 21 14.6 Weight Package 2 Package 3 Package 4 22 21 19 19 20 23 19 20 20 22 15. Calculate 30 upper and lower control limits for the Mean. a. UCL 23.05; LCL 18.15 22.64; LCL 18.56 b. UCL c. UCL 26.6: LCL = 24 21 21 19 20 b. 23 c. 20.6 d. 19 e. 21 15. Calculate 30 upper and lower control limits for the Mean. a. UCL = 23.05; LCL = 18.15 I b. UCL 22.64; LCL = 18.56 c. UCL-26.6; LCL 14.6 d. UCL 22.21; LCL 18.98 e. UCL = 23.7; LCL = 17.5 16. Is this process in control? a. Monday sample is above the UCL; all others are within limits. The process is not in control. b. Tuesday sample is above the UCL; all others are within limits. The process is not in control. c. Wednesday sample is below the LCL; all others are within limits. The process is not in control. d. Thursday sample is below the LCL; all others are within limits. The process is not in control. e. All samples are within limits. The process is in control
Step by Step Solution
There are 3 Steps involved in it

Get step-by-step solutions from verified subject matter experts