

Question: Problem B ( 2 0 points ) : You have been assigned to analyze emissions data statistically provided to you in an excel file (
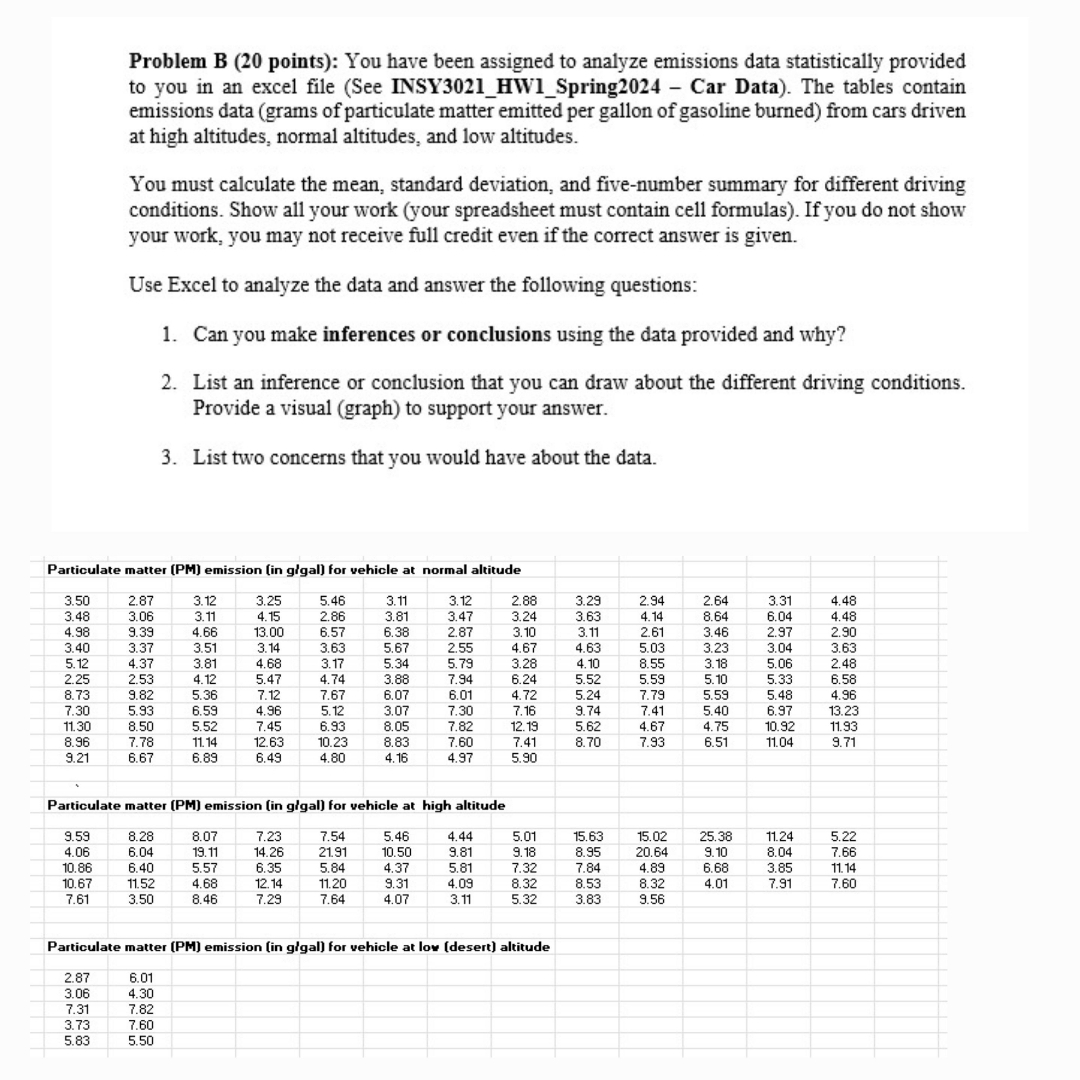
Problem B points: You have been assigned to analyze emissions data statistically provided to you in an excel file See INSYHWSpring Car Data The tables contain emissions data grams of particulate matter emitted per gallon of gasoline burned from cars driven at high altitudes, normal altitudes, and low altitudes.
You must calculate the mean, standard deviation, and fivenumber summary for different driving conditions. Show all your work your spreadsheet must contain cell formulas If you do not show your work, you may not receive full credit even if the correct answer is given.
Use Excel to analyze the data and answer the following questions:
Can you make inferences or conclusions using the data provided and why?
List an inference or conclusion that you can draw about the different driving conditions. Provide a visual graph to support your answer.
List two concerns that you would have about the data.
tableParticulate matter PM emission in glgal for vehicle at normal altitudeParticulate matter PM emission in glgal for vehicle at high altitudeParticulate matter PM emission in glgal for vehicle at lov desert altitude
Step by Step Solution
There are 3 Steps involved in it
1 Expert Approved Answer
Step: 1 Unlock

Question Has Been Solved by an Expert!
Get step-by-step solutions from verified subject matter experts
Step: 2 Unlock
Step: 3 Unlock