

Question: Problem B: Grade distribution (5 points) Read in statistics.csv (generated in Problem A) and use the statistics to make a histogram.txt file that uses
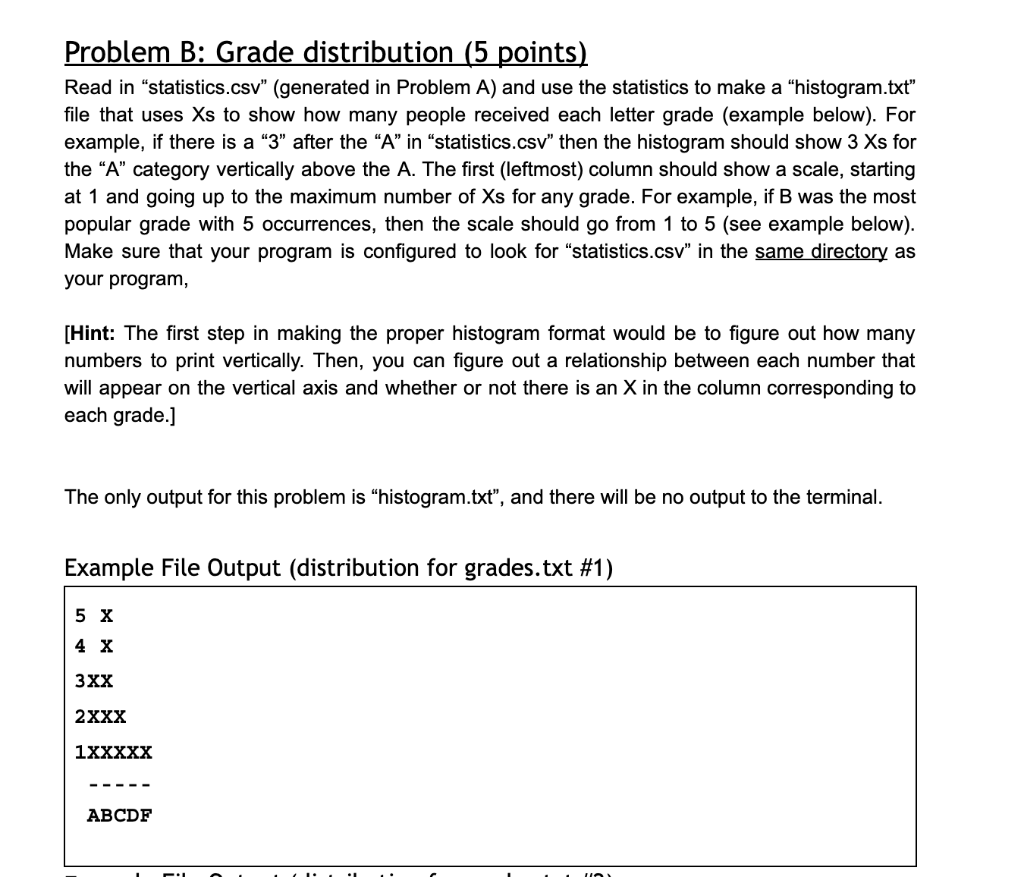
Problem B: Grade distribution (5 points) Read in statistics.csv" (generated in Problem A) and use the statistics to make a "histogram.txt" file that uses Xs to show how many people received each letter grade (example below). For example, if there is a "3" after the "A" in "statistics.csv" then the histogram should show 3 Xs for the "A" category vertically above the A. The first (leftmost) column should show a scale, starting at 1 and going up to the maximum number of Xs for any grade. For example, if B was the most popular grade with 5 occurrences, then the scale should go from 1 to 5 (see example below). Make sure that your program is configured to look for "statistics.csv" in the same directory as your program, [Hint: The first step in making the proper histogram format would be to figure out how many numbers to print vertically. Then, you can figure out a relationship between each number that will appear on the vertical axis and whether or not there is an X in the column corresponding to each grade.] The only output for this problem is "histogram.txt", and there will be no output to the terminal. Example File Output (distribution for grades.txt #1) 5 X 4 x 3XX 2XXX 1XXXXX ----- ABCDF -
Step by Step Solution
There are 3 Steps involved in it
To solve this problem youll need to write a Python script that reads the statisticscsv file and generates a histogramtxt file displaying the grade dis... View full answer

Get step-by-step solutions from verified subject matter experts