

Question: Problem Five (10 points) Presented below is information for Hartman, Inc.: Hartman, Inc. has prepared the following comparative balance sheets for 2017 and 2018: Cash
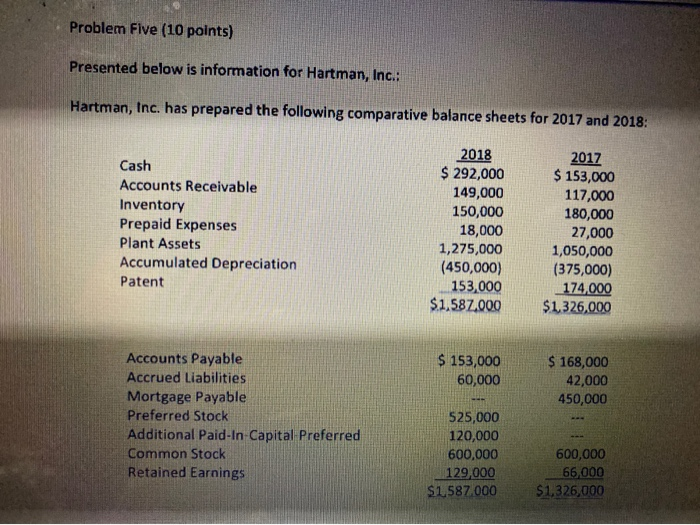
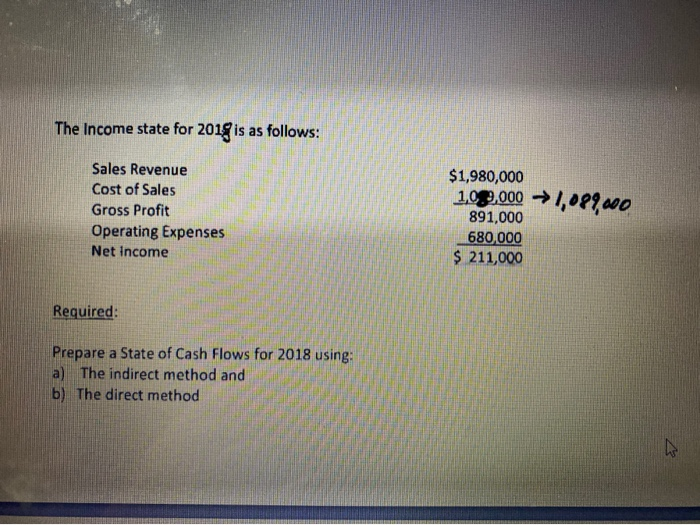
Problem Five (10 points) Presented below is information for Hartman, Inc.: Hartman, Inc. has prepared the following comparative balance sheets for 2017 and 2018: Cash Accounts Receivable Inventory Prepaid Expenses Plant Assets Accumulated Depreciation Patent 2018 $ 292,000 149,000 150,000 18,000 1,275,000 (450,000) 153,000 $1.587.000 2017 $ 153,000 117,000 180,000 27,000 1,050,000 (375,000) 174,000 $1.326,000 $ 153,000 60,000 $ 168,000 42,000 450,000 Accounts Payable Accrued Liabilities Mortgage Payable Preferred Stock Additional Paid-In-Capital Preferred Common Stock Retained Earnings 525,000 120,000 600,000 129,000 $1.587.000 600,000 66,000 $1.326,000 The Income state for 2018 is as follows: Sales Revenue Cost of Sales Gross Profit Operating Expenses Net Income $1,980,000 109,000 1,089200 891,000 680,000 $ 211,000 Required: Prepare a State of Cash Flows for 2018 using: a) The indirect method and b) The direct method
Step by Step Solution
There are 3 Steps involved in it

Get step-by-step solutions from verified subject matter experts