

Question: Problem: Five samples of variable size are collected, and the compressive strengths ( in psi ) are shown in the following Table. X - bar
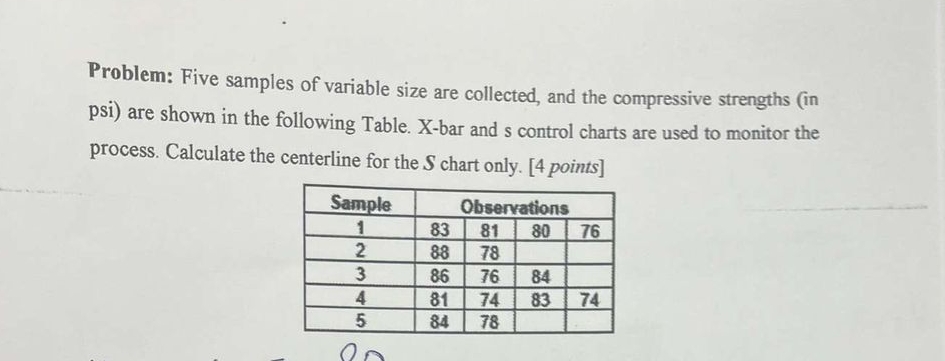
Problem: Five samples of variable size are collected, and the compressive strengths in psi are shown in the following Table. Xbar and s control charts are used to monitor the process. Calculate the centerline for the chart only. points
tableSampleObservations
Step by Step Solution
There are 3 Steps involved in it
1 Expert Approved Answer
Step: 1 Unlock

Question Has Been Solved by an Expert!
Get step-by-step solutions from verified subject matter experts
Step: 2 Unlock
Step: 3 Unlock