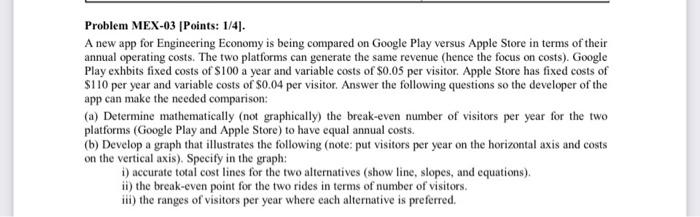
Question: Problem MEX-03 [Points: 1/4). A new app for Engineering Economy is being compared on Google Play versus Apple Store in terms of their annual operating

Problem MEX-03 [Points: 1/4). A new app for
Problem MEX-03 [Points: 1/4). A new app for Engineering Economy is being compared on Google Play versus Apple Store in terms of their annual operating costs. The two platforms can generate the same revenue (hence the focus on costs). Google Play exhbits fixed costs of $100 a year and variable costs of $0.05 per visitor. Apple Store has fixed costs of $110 per year and variable costs of $0.04 per visitor. Answer the following questions so the developer of the app can make the needed comparison: (a) Determine mathematically (not graphically) the break-even number of visitors per year for the two platforms (Google Play and Apple Store) to have equal annual costs. (b) Develop a graph that illustrates the following (note: put visitors per year on the horizontal axis and costs on the vertical axis). Specify in the graph: 1) accurate total cost lines for the two alternatives (show line, slopes, and equations). ii) the break-even point for the two rides in terms of number of visitors. iii) the ranges of visitors per year where each alternative is preferred

Step by Step Solution

There are 3 Steps involved in it

1 Expert Approved Answer
Step: 1 Unlock blur-text-image
Question Has Been Solved by an Expert!

Get step-by-step solutions from verified subject matter experts

Step: 2 Unlock
Step: 3 Unlock

Students Have Also Explored These Related General Management Questions!