

Question: Problem Scenario B - Data Analysis A series of experiments has been performed to investigate the growth characteristics of Azospirillium brasilense in a substrate containing
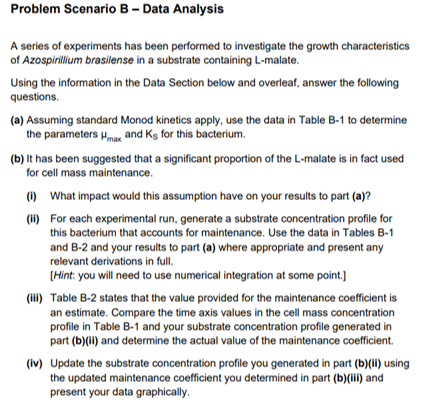
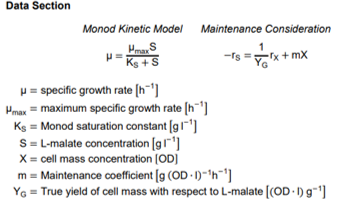
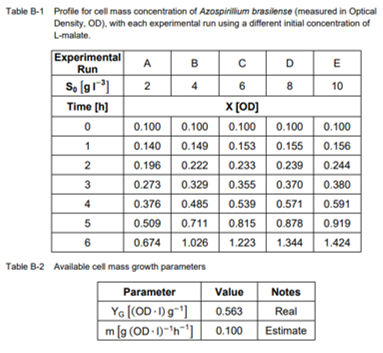
Problem Scenario B - Data Analysis A series of experiments has been performed to investigate the growth characteristics of Azospirillium brasilense in a substrate containing L-malate. Using the information in the Data Section below and overleaf, answer the following questions (a) Assuming standard Monod kinetics apply, use the data in Table B-1 to determine the parameters max and Ks for this bacterium. (b) It has been suggested that a significant proportion of the L-malate is in fact used for cell mass maintenance. 0 What impact would this assumption have on your results to part (a)? (1) For each experimental run, generate a substrate concentration profile for this bacterium that accounts for maintenance. Use the data in Tables B-1 and B-2 and your results to part (a) where appropriate and present any relevant derivations in full (Hint: you will need to use numerical integration at some point.) (IHI) Table B-2 states that the value provided for the maintenance coefficient is an estimate. Compare the time axis values in the cell mass concentration profile in Table B-1 and your substrate concentration profile generated in part (b)(ii) and determine the actual value of the maintenance coefficient. (iv) Update the substrate concentration profile you generated in part (b)(ii) using the updated maintenance coefficient you determined in part (b)(iii) and present your data graphically. Data Section Monod Kinetic Model Maintenance Consideration HS Haks + - s = x +mX Ex+ u = specific growth rate [h') Hmax = maximum specific growth rate [n-') Ks = Monod saturation constant [gr') S = L-malate concentration (91) X = cell mass concentration (OD) m=Maintenance coefficient (g (OD 1)-h"") Yo = True yield of cell mass with respect to L-malate (COD. Dg=') Table B-1 Profile for cell mass concentration of Azospirillium brasilense (measured in Optical Density, OD), with each experimental run using a different initial concentration of L-malate. - Experimental B Run D E S, (gr) 2 4 6 8 10 Time [h] X [OD] 0 0.100 0.100 0.100 0.100 0.100 1 0.140 0.149 0.153 0.155 0.156 2 0.196 0.222 0.233 0.239 0.244 3 0.273 0.329 0.355 0.370 0.380 4 0.376 0.485 0.539 0.571 0.591 5 0.509 0.711 0.815 0.878 0.919 6 0.674 1.026 1.223 1.344 1.424 Table B-2 Available cel mass growth parameters Parameter Value Notes Yo [COD. 18"') 0.563 Real m (g(OD. 1)-h"') 0.100 Estimate WN
Step by Step Solution
There are 3 Steps involved in it

Get step-by-step solutions from verified subject matter experts