

Question: Problem Scenario B - Model Development The Gompertz function is a sigmoidal mathematical model that can be used to describe population growth, where y0 is
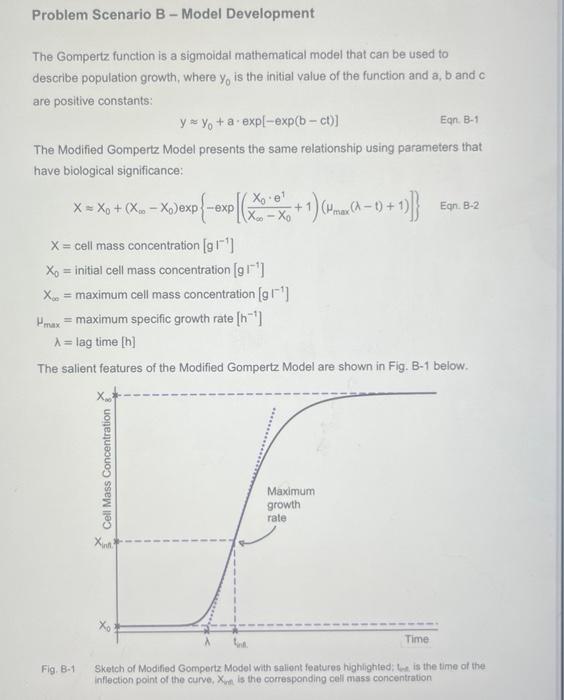
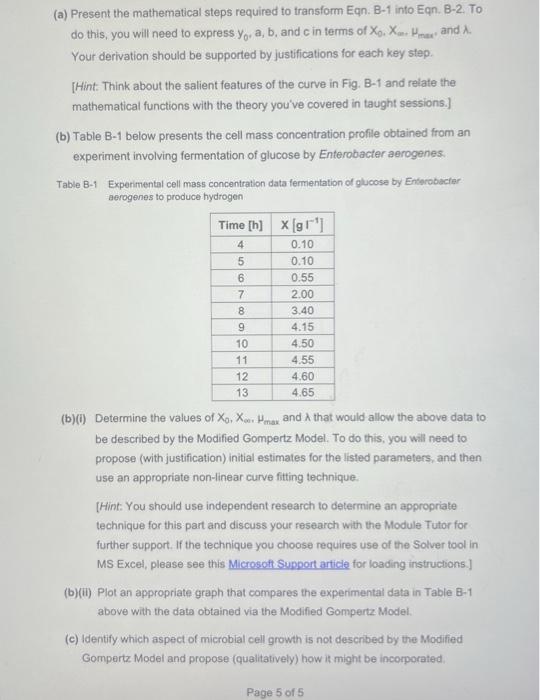
Problem Scenario B - Model Development The Gompertz function is a sigmoidal mathematical model that can be used to describe population growth, where y0 is the initial value of the function and a,b and c are positive constants: yy0+aexp[exp(bct)] Ean. B-1 The Modified Gompertz Model presents the same relationship using parameters that have biological significance: XX0XmaxXX0+(XX0)exp{exp[(XX0X0e1+1)(max(t)+1)]}Eqn.B2=cellmassconcentration[g1]=initialcellmassconcentration[g1]=maximumcellmassconcentration[g1]=maximumspecificgrowthrate[h1]=lagtime[h] The salient features of the Modified Gompertz Model are shown in Fig. B-1 below. Fig. 8-1 Sketch of Modified Gompertz Model with saliont features highighted; Gn is the time of the inflection point of the curve, X int is the corresponding cell mass concentration (a) Present the mathematical steps required to transform Eqn. B-1 into Eqn. B-2. To do this, you will need to express y0,a,b, and c in terms of X0,Xmen,max, and . Your derivation should be supported by justifications for each key step. [Hint. Think about the salient features of the curve in Fig. B-1 and relate the mathematical functions with the theory you've covered in taught sessions.] (b) Table B-1 below presents the cell mass concentration profile obtained from an experiment involving fermentation of glucose by Enterobacter aerogenes: Table B-1 Experimental cell mass concentration data fermentation of gucose by Enterobicter aerogenes to produce hydrogen (b)(i) Determine the values of X0,X. max and that would allow the above data to be described by the Modified Gompertz Model. To do this, you will need to propose (with justification) initial estimates for the listed parameters, and then use an appropriate non-linear curve fitting technique. [Hint: You should use independent research to determine an appropriate technique for this part and discuss your research with the Module Tutor for further support. If the technique you choose requires use of the Solver tool in MS Excel, please see this Microsoft Support article for loading instructions.] (b)(ii) Plot an appropriate graph that compares the experimental data in Table B-1 above with the data obtained via the Modified Gompertz Model. (c) Identify which aspect of microbial cell growth is not described by the Modified Gompertz Model and propose (qualitatively) how it might be incorporated
Step by Step Solution
There are 3 Steps involved in it

Get step-by-step solutions from verified subject matter experts