

Question: Problem Set 2.2.a: Interpret Means in a Chart Criterion: Interpret means in a chart. Instructions: Read the information below and answer the questions. Data:
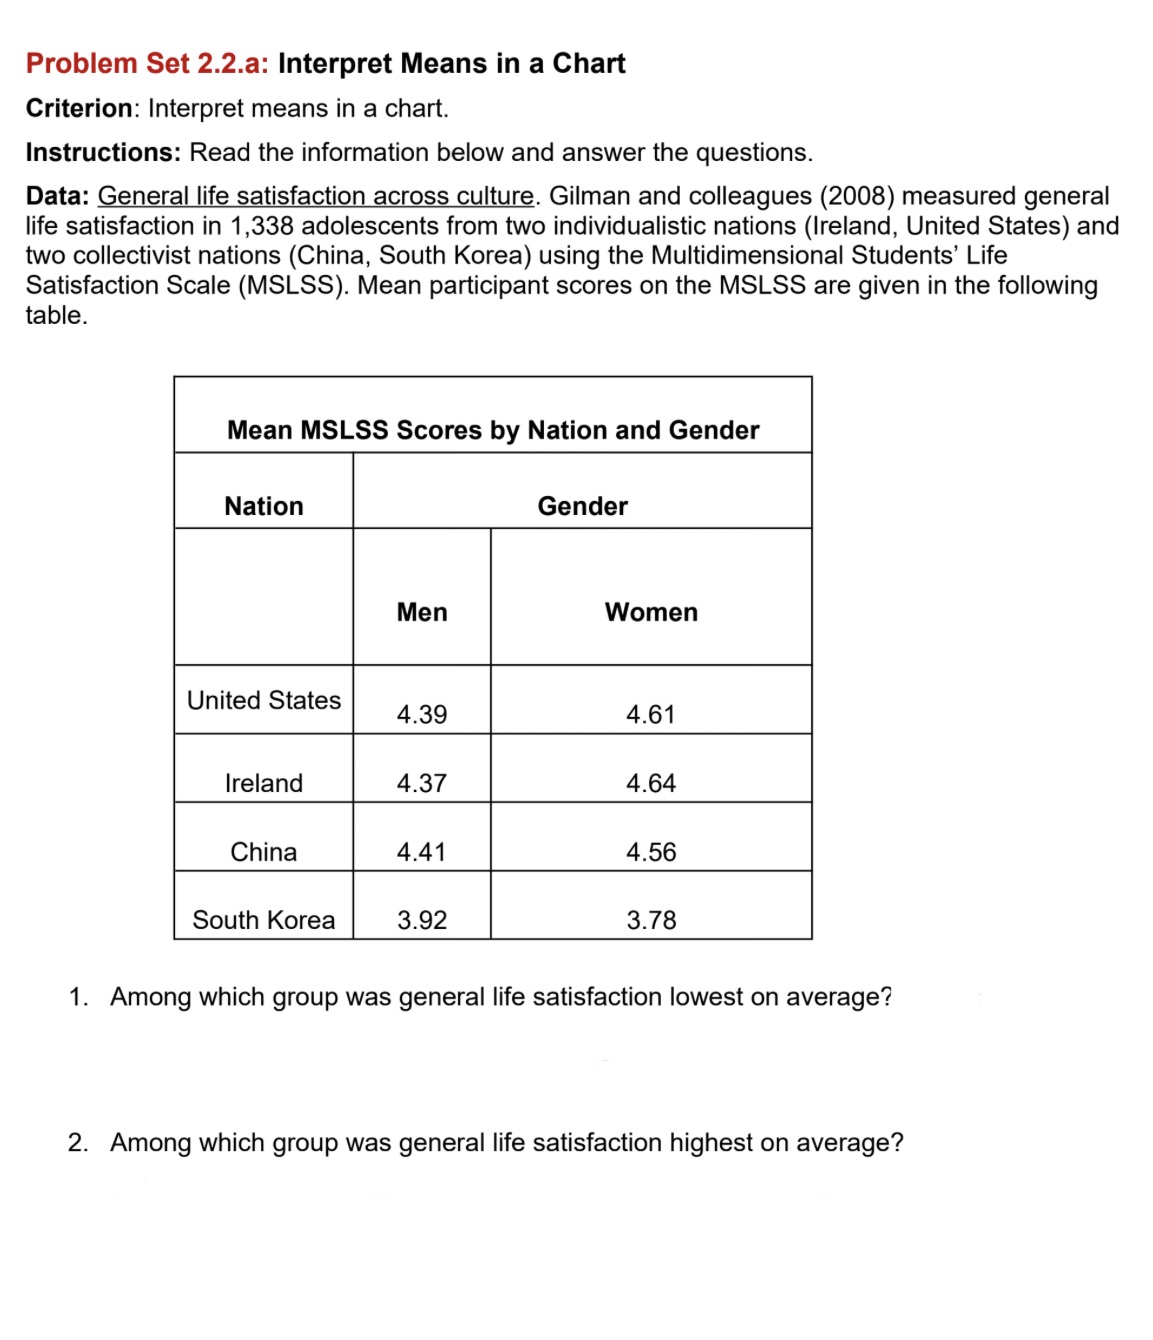
Problem Set 2.2.a: Interpret Means in a Chart Criterion: Interpret means in a chart. Instructions: Read the information below and answer the questions. Data: General life satisfaction across culture. Gilman and colleagues (2008) measured general life satisfaction in 1,338 adolescents from two individualistic nations (Ireland, United States) and two collectivist nations (China, South Korea) using the Multidimensional Students' Life Satisfaction Scale (MSLSS). Mean participant scores on the MSLSS are given in the following table. Mean MSLSS Scores by Nation and Gender Nation Gender Men Women United States 4.39 4.61 Ireland 4.37 4.64 China 4.41 4.56 South Korea 3.92 3.78 1. Among which group was general life satisfaction lowest on average? 2. Among which group was general life satisfaction highest on average?
Step by Step Solution
There are 3 Steps involved in it

Get step-by-step solutions from verified subject matter experts