

Question: Problem Set 9 Note: You will find the Example videos in the module very helpful in answering these questions. Please type in the space provided.
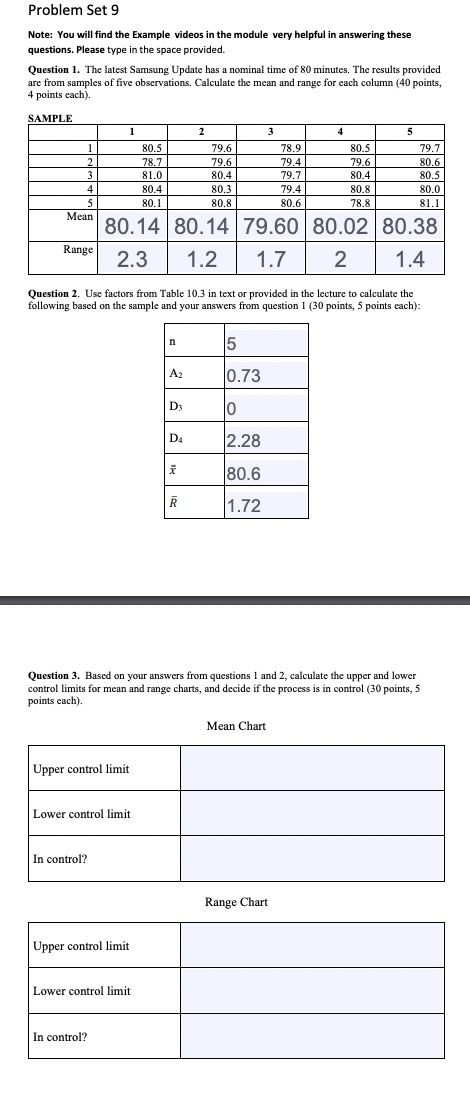
Problem Set 9 Note: You will find the Example videos in the module very helpful in answering these questions. Please type in the space provided. Question 1. The latest Samsung Update has a nominal time of 80 minutes. The results provided are from samples of five observations. Calculate the mean and range for each column ( 40 points, 4 points each). Question 2. Use factors from Table 10.3 in text or provided in the lecture to calculate the following based on the sample and your answers from question 1 ( 30 points, 5 points each): Question 3. Based on your answers from questions 1 and 2, calculate the upper and lower control limits for mean and range charts, and decide if the process is in control (30 points, 5 points each). Mean Chart Range Chart
Step by Step Solution
There are 3 Steps involved in it

Get step-by-step solutions from verified subject matter experts