

Question: Problem Simeon Problem - ABC vs XYC Simeon Company Comparative Income Statement Sdollars 2016 2016 Sales Cost of goods sold Gross profit on sales 600,000
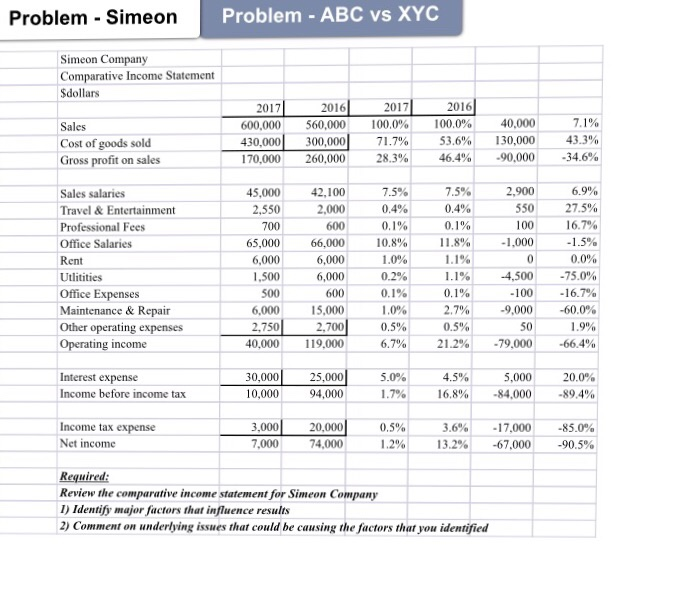
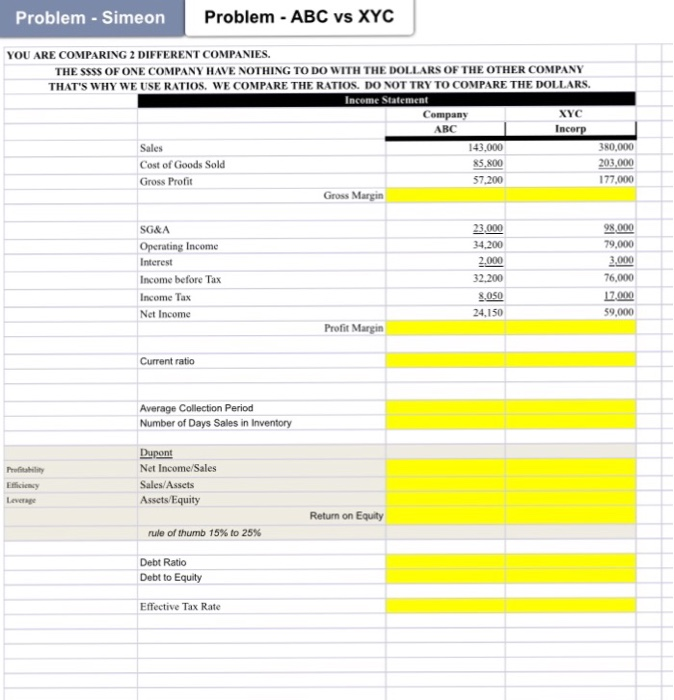
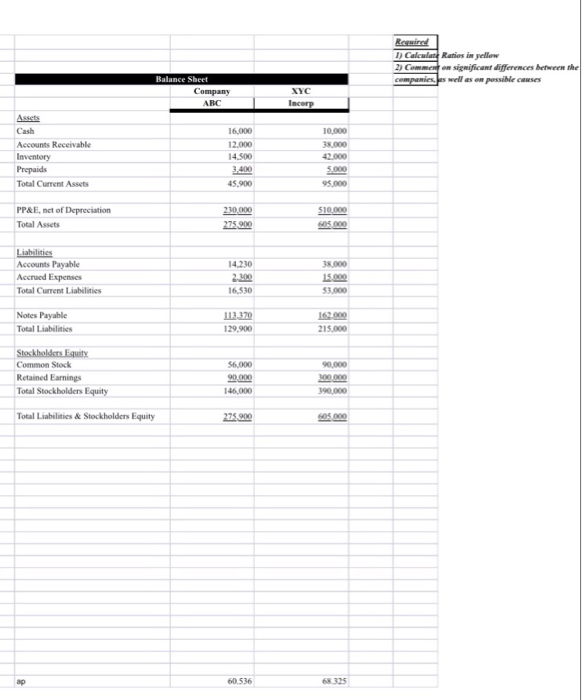
Problem Simeon Problem - ABC vs XYC Simeon Company Comparative Income Statement Sdollars 2016 2016 Sales Cost of goods sold Gross profit on sales 600,000 560,000 100.0% 100.0% 40,000 430,00030, 170,000 260,000 28.3% 7.1% 43.3% 000-34.6% 000 71.7% 53.6% 130,000 46.4% -90, 7.5% 0.4% 0.1% 11.8% 1.1% 1.1% 2,900 6.9% 27.5% 16.7% 7.5% Sales salaries Travel&Entertainment Professional Fees Office Salaries Rent Utlitities Office Expenses Maintenance& Repair Other operating expenses 5,000 42,100 2,000 600 66,000 6,000 6,000 600 15,000 2.700 40,000 119.000 2,550 700 65,000 6,000 1,500 500 6,000 2.750 550 -1,000 -4,500 0.4% 10.8% 10% 0.2% 0.1% 1.0% 0.5% 6.7% 0.0% 75.0% 16.7% -9,000-60.0% 1.9% -79.000-66.4% 100 2.7% 0.5% 21.2% 50 ncome Interest expense Income before income tax 30,000 10,000 25,000 94,000 5.0% 1.7% 4.5% % 20.0% -84.000-89.4% 5,000 16.8 Income tax expense Net income 3,000 7,000 20,000 74,000 0.5% 1.2% 3.6% 13.2% -17.000-85.0% -67.000-90.5% Required: Review the comparative income statement for Simeon Company I) Identify major factors that influence results 2) Comment on underlying issues that could be causing the factors that you identified Problem -Simeon Problem ABC vs XYC YOU ARE COMPARING 2 DIFFERENT COMPANIES THE SSSS OF ONE COMPANY HAVE NOTHING TO DO WITH THE DOLLARS OF THE OTHER COMPANY THAT'S WHY WE USE RATIOS, WE COMPARE THE RATIOS. DO NOT TRY TO COMPARE THE DOLLARS ABC Sales Cost of Goods Sold Gross Profit 143,000 85,800 57.200 380,000 3,000 177,000 Gross Margin 23,000 34.200 SG&A 79,000 3.000 76,000 17.000 59,000 Operating Income 32.200 Income before Tax Income Tax Net Income 24,150 Profit Margin Current ratio Average Collection Period Number of Days Sales in Inventory Dupont Net Income/Sales Sales/Assets Assets/Equity Return on Equity rule of thumb 15% to 25% Debt Ratio Debt to Equity Effective Tax Rate Calculatt Ratios in yellow Commntn sigmificant differences between the ompaniess well as on possible canses ABC Assets Cash Accounts Receivable Inventory Prepaids Total Current Assets 16,000 12.000 14.500 10,000 45,900 PP&E, nct of Depreciation Total Assets Accounts Payable Accrued Expenses Total Curment Liabelities 4,230 16,530 53,000 Notes Payable Total Liabilities 62000 215,000 29,900 Common Stock Retained Earnings Total Stockholders Equity 146,000 Total Liabilities& Stockholders Equity ap 60.536 68 325 Problem Simeon Problem - ABC vs XYC Simeon Company Comparative Income Statement Sdollars 2016 2016 Sales Cost of goods sold Gross profit on sales 600,000 560,000 100.0% 100.0% 40,000 430,00030, 170,000 260,000 28.3% 7.1% 43.3% 000-34.6% 000 71.7% 53.6% 130,000 46.4% -90, 7.5% 0.4% 0.1% 11.8% 1.1% 1.1% 2,900 6.9% 27.5% 16.7% 7.5% Sales salaries Travel&Entertainment Professional Fees Office Salaries Rent Utlitities Office Expenses Maintenance& Repair Other operating expenses 5,000 42,100 2,000 600 66,000 6,000 6,000 600 15,000 2.700 40,000 119.000 2,550 700 65,000 6,000 1,500 500 6,000 2.750 550 -1,000 -4,500 0.4% 10.8% 10% 0.2% 0.1% 1.0% 0.5% 6.7% 0.0% 75.0% 16.7% -9,000-60.0% 1.9% -79.000-66.4% 100 2.7% 0.5% 21.2% 50 ncome Interest expense Income before income tax 30,000 10,000 25,000 94,000 5.0% 1.7% 4.5% % 20.0% -84.000-89.4% 5,000 16.8 Income tax expense Net income 3,000 7,000 20,000 74,000 0.5% 1.2% 3.6% 13.2% -17.000-85.0% -67.000-90.5% Required: Review the comparative income statement for Simeon Company I) Identify major factors that influence results 2) Comment on underlying issues that could be causing the factors that you identified Problem -Simeon Problem ABC vs XYC YOU ARE COMPARING 2 DIFFERENT COMPANIES THE SSSS OF ONE COMPANY HAVE NOTHING TO DO WITH THE DOLLARS OF THE OTHER COMPANY THAT'S WHY WE USE RATIOS, WE COMPARE THE RATIOS. DO NOT TRY TO COMPARE THE DOLLARS ABC Sales Cost of Goods Sold Gross Profit 143,000 85,800 57.200 380,000 3,000 177,000 Gross Margin 23,000 34.200 SG&A 79,000 3.000 76,000 17.000 59,000 Operating Income 32.200 Income before Tax Income Tax Net Income 24,150 Profit Margin Current ratio Average Collection Period Number of Days Sales in Inventory Dupont Net Income/Sales Sales/Assets Assets/Equity Return on Equity rule of thumb 15% to 25% Debt Ratio Debt to Equity Effective Tax Rate Calculatt Ratios in yellow Commntn sigmificant differences between the ompaniess well as on possible canses ABC Assets Cash Accounts Receivable Inventory Prepaids Total Current Assets 16,000 12.000 14.500 10,000 45,900 PP&E, nct of Depreciation Total Assets Accounts Payable Accrued Expenses Total Curment Liabelities 4,230 16,530 53,000 Notes Payable Total Liabilities 62000 215,000 29,900 Common Stock Retained Earnings Total Stockholders Equity 146,000 Total Liabilities& Stockholders Equity ap 60.536 68 325
Step by Step Solution
There are 3 Steps involved in it

Get step-by-step solutions from verified subject matter experts