

Question: Problem Statement A fellow engineer has recorded raw stress - strain data ( elongation vs . force ) for several samples. Your role is to
Problem Statement
A fellow engineer has recorded raw stressstrain data elongation vs force for several samples. Your role is to develop a MATLAB program to simplify the analysis of the many samples available and compare the results. He has provided you with samples of data. The samples include HIPS, Nylon ABS, and Polypropylene plastics. The samples were in the form of standard 'dog bone' formats with the following characteristics.
tableTable : Material DescriptionMaterialtableCrosssectional AreammDiameter mmtableGauge LengthmmHIPSNylonABSPolypropylene
The code must ask for the crosssectional area, diameter, and gauge length. ie The code must be interactive. When the code is ran, it should ask about the data pathfolderaddress it should say Is the crosssectional area circular? YN then be followed by several interactive questions. Expectations are to provide: Elongation Curves Position vs Load Stress Strain Curves Strain vs Stress Modulus of Elasticity, Ultimate Stress, and Fracture for each material. Plot elongation curves and Stress Strain curves on the same plot so they can be readily compared. Include legends. The MATLAB code should be able to be run for each dataset with output presented for easy understanding of the results in the Engineering Analysis Format. The code must have comments for every line explaining what is going on
tableTable : Data DescriptionParameter,UnitstableElongationDataLoad,NewtonsPosition,mmTime,sec
tableTable : File Descriptions,File Name,Sample NameHIPScSvHIPSNyloncSVNylonABScSVABSPolycsvPolypropylene
Background
For extensive background see
EngineeringToolbox.com and other sources.
An Elongation Curve represents Position vs Load. This illustrates the raw data as collected.
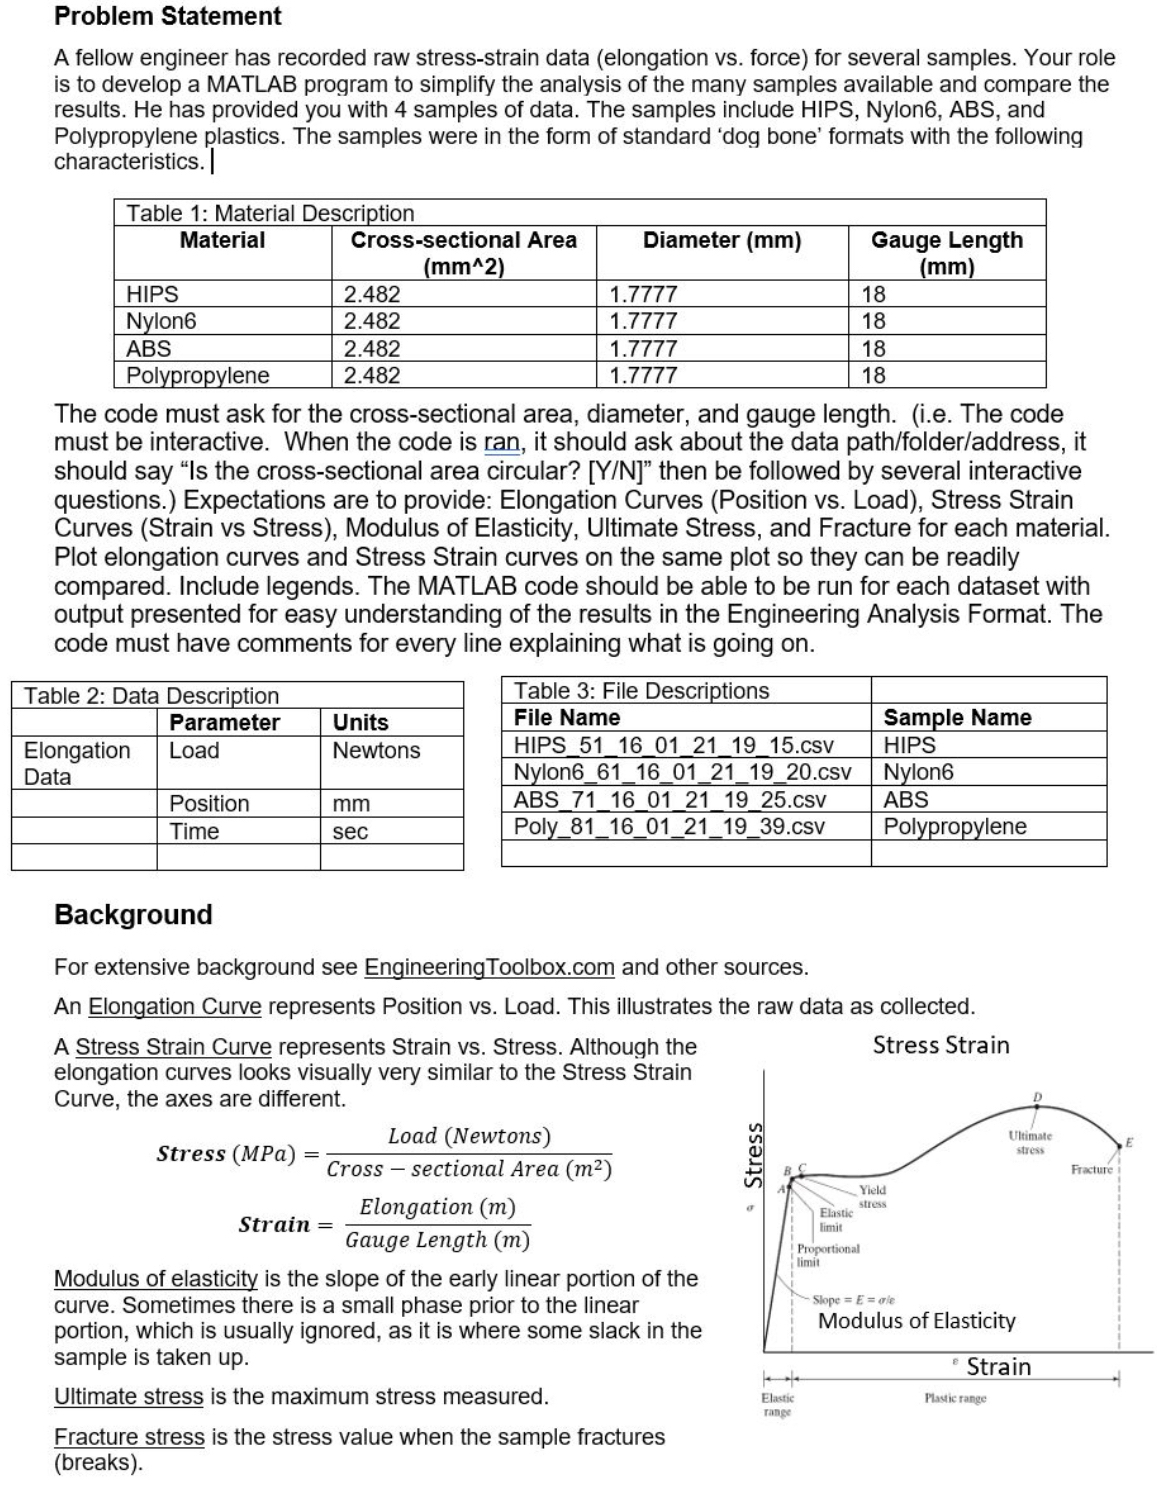
A Stress Strain Curve represents Strain vs Stress. Although the Stress Strain elongation curves looks visually very similar to the Stress Strain Curve, the axes are different.
Stress
Strain
Modulus of elasticity is the slope of the early linear portion of the curve. Sometimes there is a small phase prior to the linear portion, which is usually ignored, as it is where some slack in the sample is taken up
Ultimate stress is the maximum stress measured.
Fracture stress is the stress value when the sample fractures breaks Matlab code with the correct way to use the files and have matlab read it
Step by Step Solution
There are 3 Steps involved in it
1 Expert Approved Answer
Step: 1 Unlock

Question Has Been Solved by an Expert!
Get step-by-step solutions from verified subject matter experts
Step: 2 Unlock
Step: 3 Unlock