

Question: Problem Statement: Create a MATLAB figure with four subplots arranged in a 2 2 grid. Each subplot should contain a plot of a different mathematical
Problem Statement:
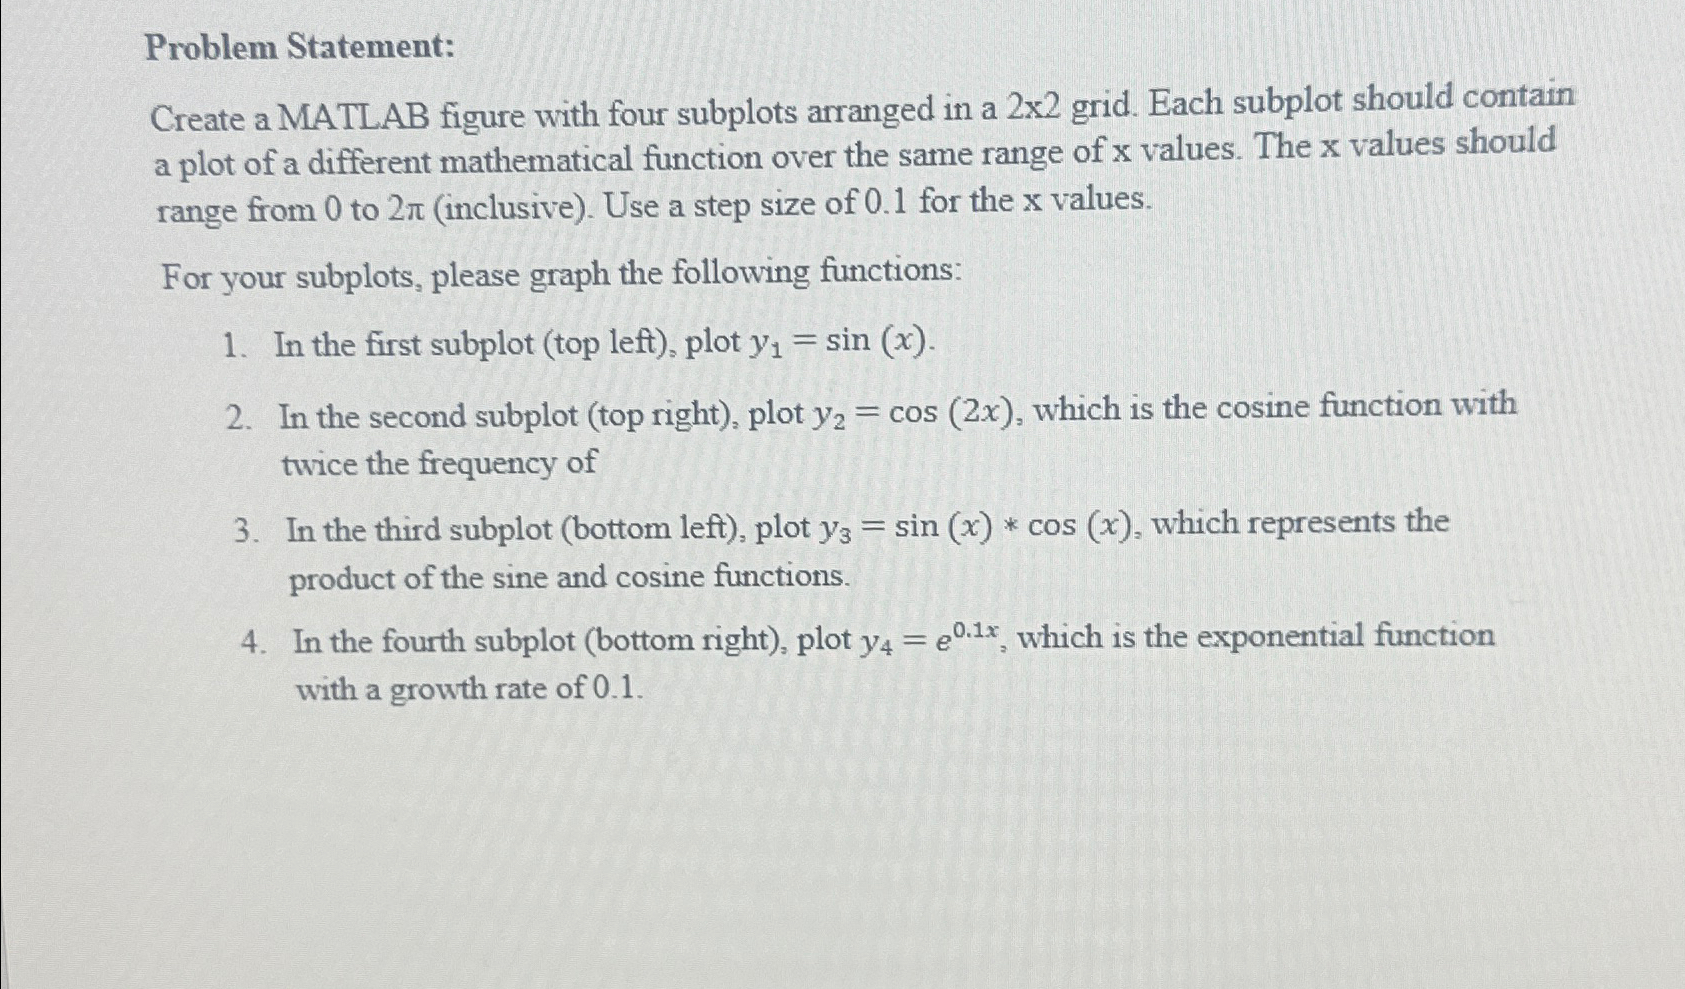
Create a MATLAB figure with four subplots arranged in a grid. Each subplot should contain a plot of a different mathematical function over the same range of values. The values should range from to inclusive Use a step size of for the values.
For your subplots, please graph the following functions:
In the first subplot top left plot
In the second subplot top right plot which is the cosine function with twice the frequency of
In the third subplot bottom left plot which represents the product of the sine and cosine functions.
In the fourth subplot bottom right plot which is the exponential function with a growth rate of
Step by Step Solution
There are 3 Steps involved in it
1 Expert Approved Answer
Step: 1 Unlock

Question Has Been Solved by an Expert!
Get step-by-step solutions from verified subject matter experts
Step: 2 Unlock
Step: 3 Unlock