

Question: Problem Statement: Plot the column curve, as defined in AISC Specification Section E 3 , two ways for each of the cases listed below. The
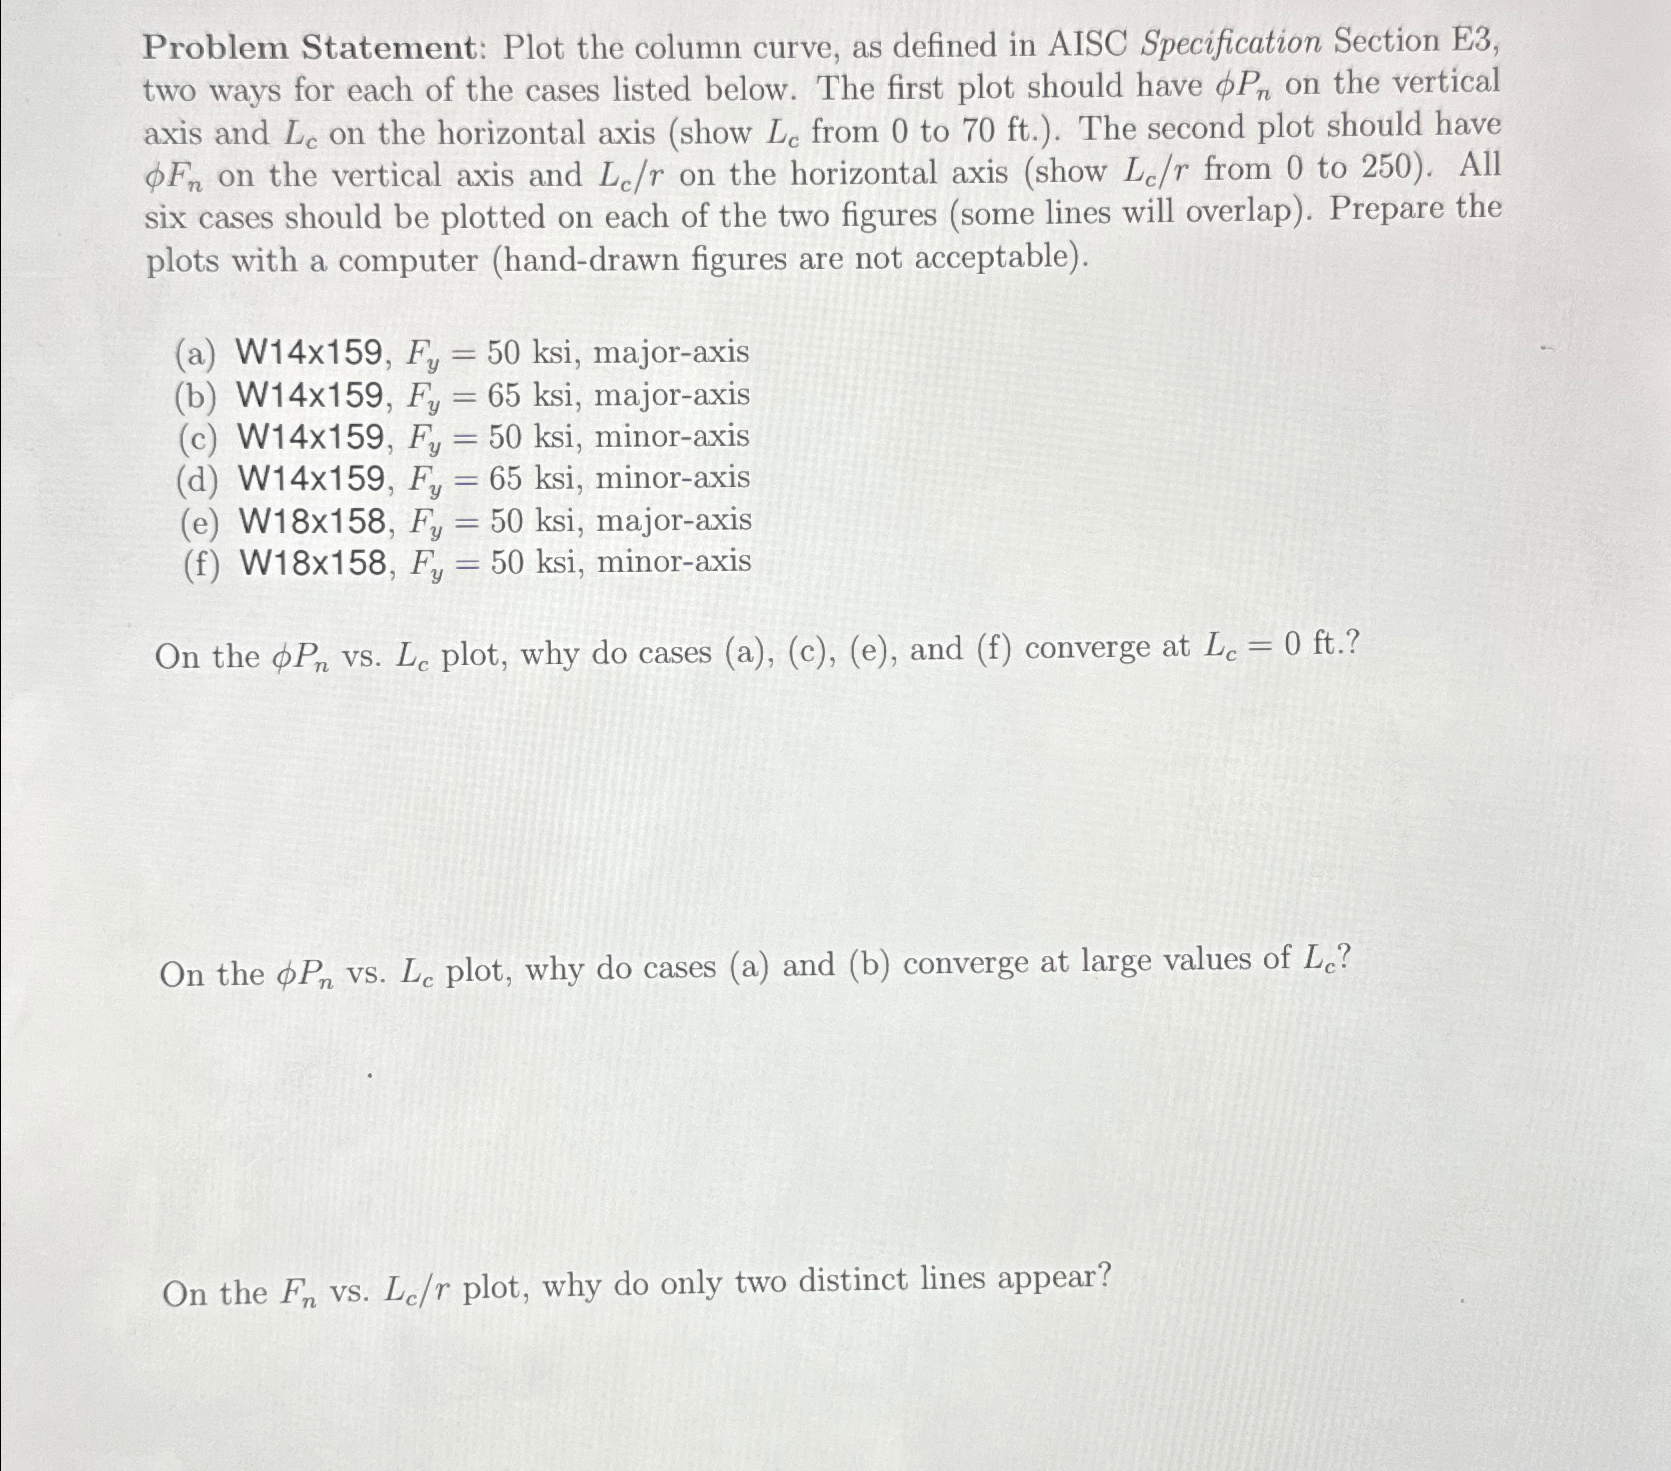
Problem Statement: Plot the column curve, as defined in AISC Specification Section E two ways for each of the cases listed below. The first plot should have on the vertical axis and on the horizontal axis show from to The second plot should have on the vertical axis and on the horizontal axis show from to All six cases should be plotted on each of the two figures some lines will overlap Prepare the plots with a computer handdrawn figures are not acceptable
aksi, majoraxis
b Wxksi, majoraxis
cksi, minoraxis
d Wxksi, minoraxis
eksi, majoraxis
fksi, minoraxis
On the vs plot, why do cases ace and f converge at
On the vs plot, why do cases a and b converge at large values of
On the vs plot, why do only two distinct lines appear?
Step by Step Solution
There are 3 Steps involved in it
1 Expert Approved Answer
Step: 1 Unlock

Question Has Been Solved by an Expert!
Get step-by-step solutions from verified subject matter experts
Step: 2 Unlock
Step: 3 Unlock