

Question: Problem statement: The table below provides information about a production line setup project at a factory. The ines ior activities A through C are drawn
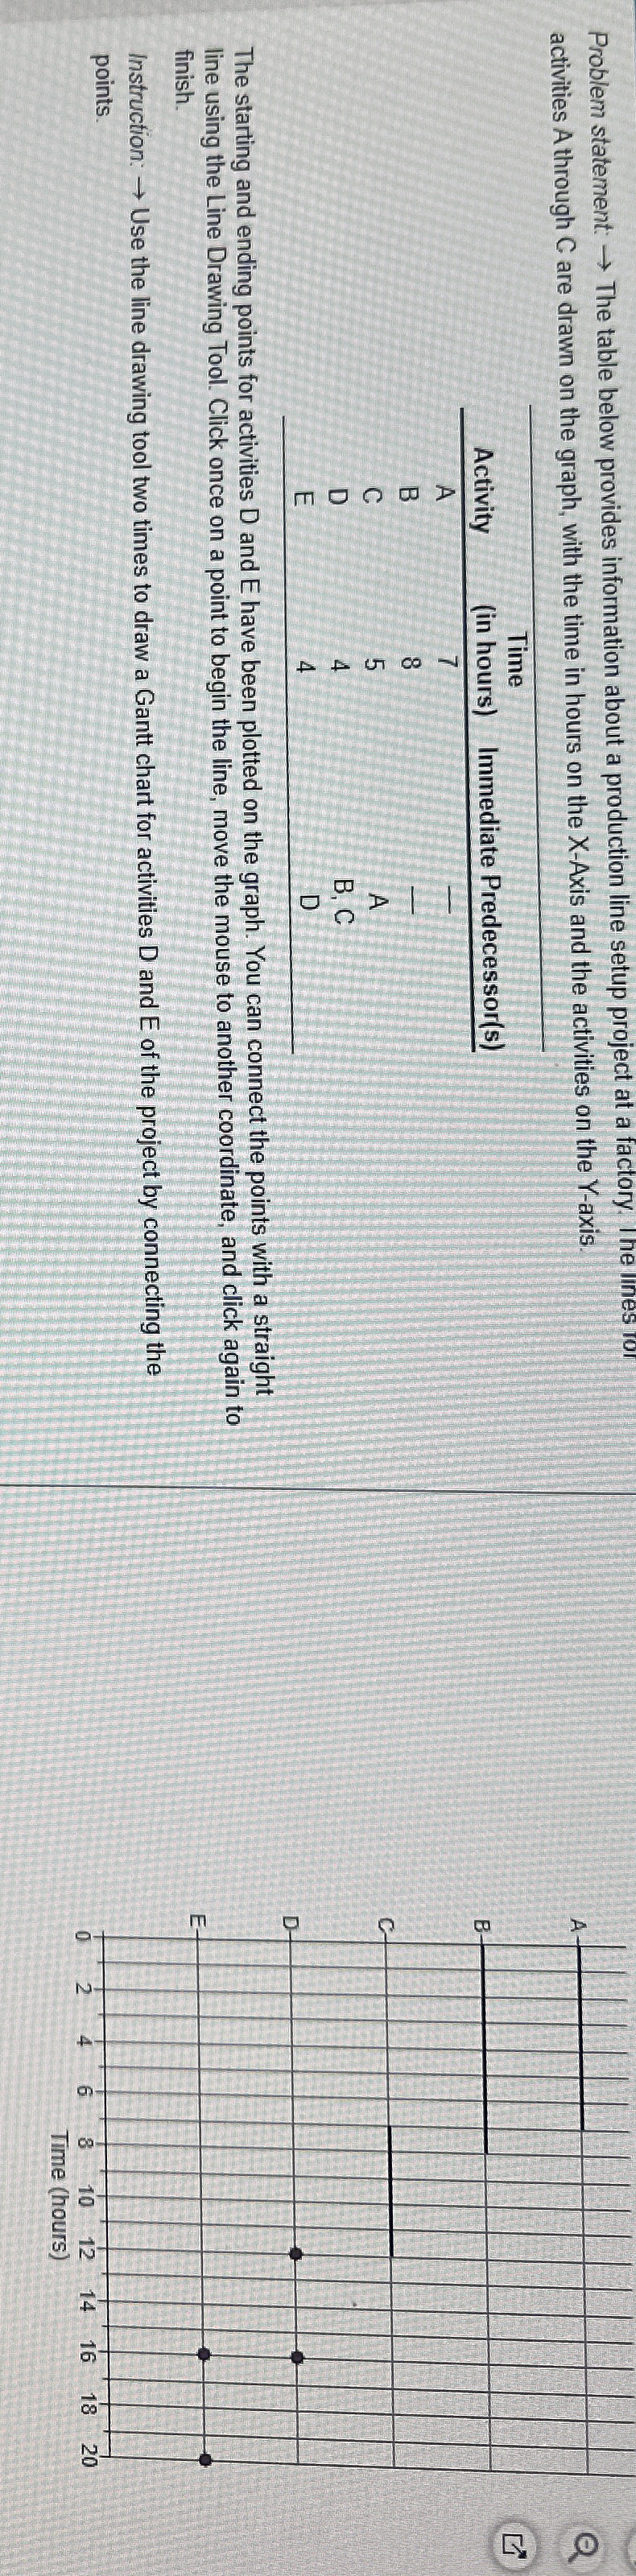
Problem statement: The table below provides information about a production line setup project at a factory. The ines ior activities A through are drawn on the graph, with the time in hours on the X Axis and the activities on the Y axis.
tableActivitytableTimein hoursImmediate PredecessorsABCADB CED
The starting and ending points for activities D and have been plotted on the graph. You can connect the points with a straight line using the Line Drawing Tool. Click once on a point to begin the line, move the mouse to another coordinate, and click again to finish.
Instruction: Use the line drawing tool two times to draw a Gantt chart for activities D and E of the project by connecting the points.
Step by Step Solution
There are 3 Steps involved in it
1 Expert Approved Answer
Step: 1 Unlock

Question Has Been Solved by an Expert!
Get step-by-step solutions from verified subject matter experts
Step: 2 Unlock
Step: 3 Unlock