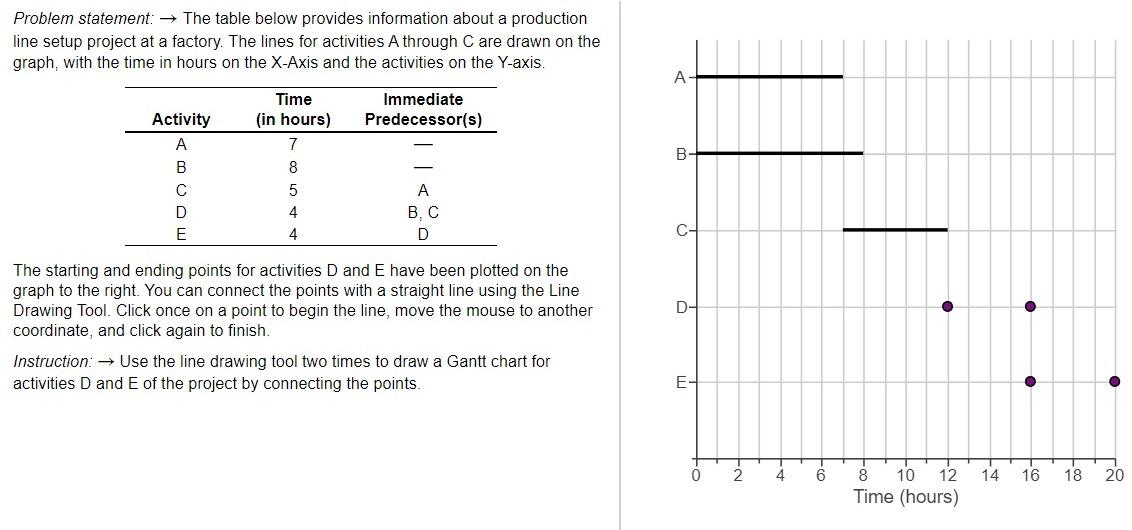
Question: Problem statement: The table below provides information about a production line setup project at a factory. The lines for activities A through C are drawn

Problem statement: The table below provides

Problem statement: The table below provides information about a production line setup project at a factory. The lines for activities A through C are drawn on the graph, with the time in hours on the X-Axis and the activities on the Y-axis. A Immediate Predecessor(s) Activity A B Time (in hours) 7 8 B C 5 4 D E B. C D 4 C- D- The starting and ending points for activities D and E have been plotted on the graph to the right. You can connect the points with a straight line using the Line Drawing Tool. Click once on a point to begin the line, move the mouse to another coordinate, and click again to finish. Instruction: Use the line drawing tool two times to draw a Gantt chart for activities D and E of the project by connecting the points. E Fo Fo 2 4 14 16 18 20 8 10 12 Time (hours)

Step by Step Solution

There are 3 Steps involved in it

1 Expert Approved Answer
Step: 1 Unlock blur-text-image
Question Has Been Solved by an Expert!

Get step-by-step solutions from verified subject matter experts

Step: 2 Unlock
Step: 3 Unlock

Students Have Also Explored These Related General Management Questions!