

Question: PROBLEM (with solution): The data below shows the Number of absences X and the Final Grade, Yof seven students in the statistics class Student Number
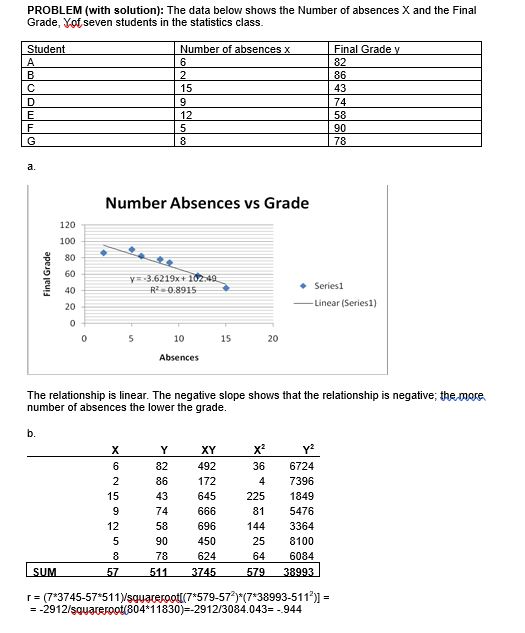
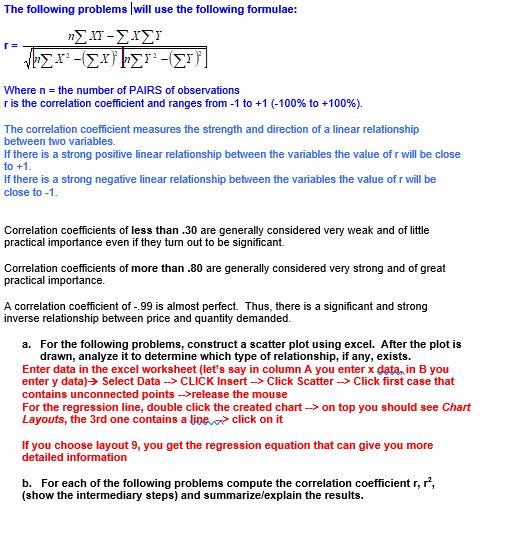
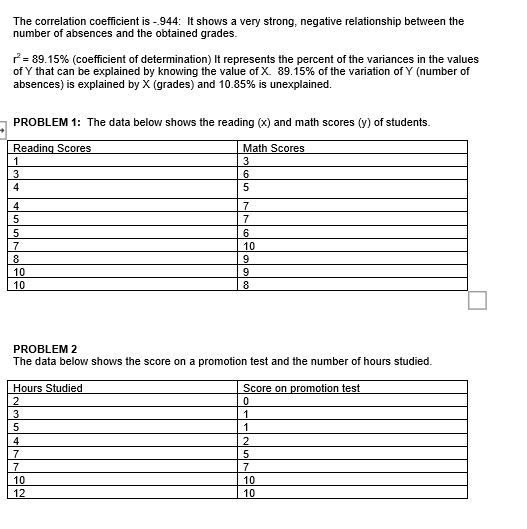
PROBLEM (with solution): The data below shows the Number of absences X and the Final Grade, Yof seven students in the statistics class Student Number of absences x Final Grade y A 6 82 B 2 86 C 15 43 D 9 74 E 12 58 F 5 90 78 a Number Absences vs Grade 120 100 80 Final Grade 60 V= -3.6219x+ 102.49 40 R . 0.8915 Series1 20 Linear (Series1) 10 15 20 Absences The relationship is linear. The negative slope shows that the relationship is negative; the more. number of absences the lower the grade. b. X Y XY Yz 82 492 36 6724 86 172 4 7396 15 43 645 225 1849 9 74 666 81 5476 12 58 696 144 3364 90 450 25 8100 78 624 64 6084 SUM 57 511 3745 579 38993 r= (7*3745-57*511)/squareroot[(7*579-57 )*(7*38993-511 )] = = -2912/squareroot(804*11830)=-2912/3084.043= -.944The following problems |will use the following formulae: MEAT - EXEr T= Where n = the number of PAIRS of observations r is the correlation coefficient and ranges from -1 to +1 (-100% to +100%). The correlation coefficient measures the strength and direction of a linear relationship between two variables. If there is a strong positive linear relationship between the variables the value of r will be close to +1. If there is a strong negative linear relationship between the variables the value of r will be close to -1. Correlation coefficients of less than .30 are generally considered very weak and of little practical importance even if they turn out to be significant Correlation coefficients of more than .80 are generally considered very strong and of great practical importance. A correlation coefficient of -.99 is almost perfect. Thus, there is a significant and strong inverse relationship between price and quantity demanded. a. For the following problems, construct a scatter plot using excel. After the plot is drawn, analyze it to determine which type of relationship, if any, exists. Enter data in the excel worksheet (let's say in column A you enter x data, in B you enter y data)> Select Data -> CLICK Insert -> Click Scatter -> Click first case that contains unconnected points ->release the mouse For the regression line, double click the created chart -> on top you should see Chart Layouts, the 3rd one contains a line> click on it If you choose layout 9, you get the regression equation that can give you more detailed information b. For each of the following problems compute the correlation coefficient r, r' (show the intermediary steps) and summarize/explain the results.The correlation coefficient is -.944: It shows a very strong, negative relationship between the number of absences and the obtained grades. = 89.15% (coefficient of determination) It represents the percent of the variances in the values of Y that can be explained by knowing the value of X. 89.15% of the variation of Y (number of absences) is explained by X (grades) and 10.85% is unexplained. PROBLEM 1: The data below shows the reading (x) and math scores (y) of students. Reading Scores Math Scores 1 3 3 6 4 7 15 7 5 6 10 8 9 10 9 10 8 PROBLEM 2 The data below shows the score on a promotion test and the number of hours studied. Hours Studied Score on promotion test 2 5 1 14 12 7 7 7 10 10 12 10
Step by Step Solution
There are 3 Steps involved in it

Get step-by-step solutions from verified subject matter experts