

Find the equation of the regression line for the data in Example 10-5, and graph the line
Question:
Find the equation of the regression line for the data in Example 10-5, and graph the line on the scatter plot.
Example 10-5
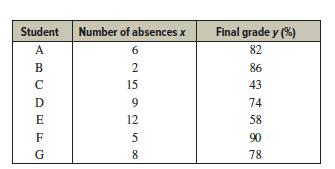
Compute the value of the linear correlation coefficient for the data obtained in the study
of the number of absences and the final grade of the seven students in the statistics class
given in Example 10 –2.
Example 10 –2
Construct a scatter plot for the data obtained in a study on the number of absences and
the final grades of seven randomly selected students from a statistics class. The data are
shown here.
Fantastic news! We've Found the answer you've been seeking!
Step by Step Answer:
The values needed for the equation are n7 Sigma x57 Sigma y511 Sigma x y3745 and Sigma x2579 S...View the full answer

Answered By
Kalyan M. Ranwa
I have more than seven years of teaching experience in physics and mechanical engineering.
1+ Reviews
10+ Question Solved
Related Book For 
Elementary Statistics A Step By Step Approach
ISBN: 9781260360653
11th Edition
Authors: Allan Bluman
Question Posted:
