

Question: Problems 1. Using the data in the student spreadsheet file Ethan Allen Financials.xlsx (to find the student spreadsheets for Financial Analysis with Microsoft Excel ,
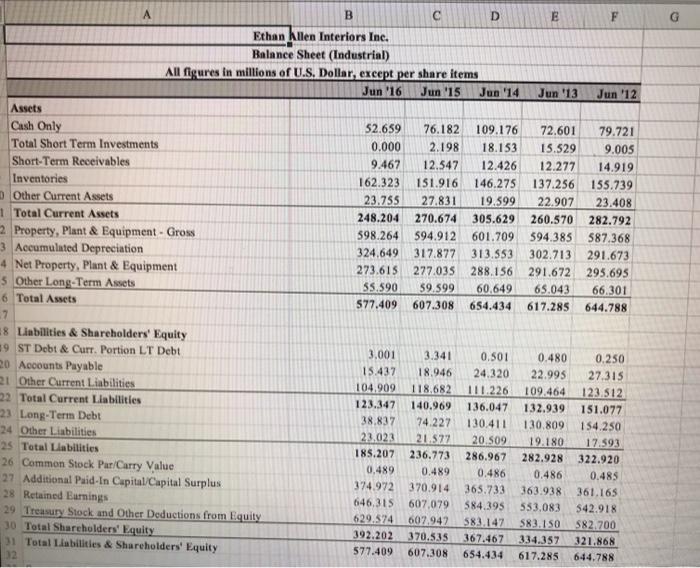
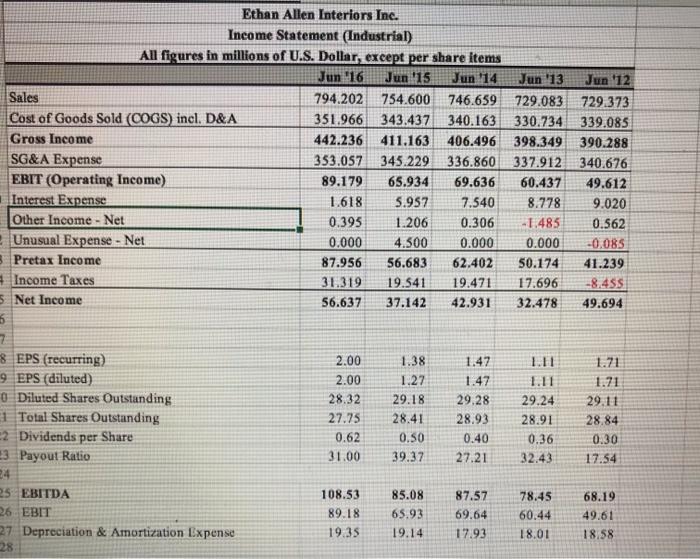
Problems 1. Using the data in the student spreadsheet file Ethan Allen Financials.xlsx (to find the student spreadsheets for Financial Analysis with Microsoft Excel , eighth edition, go to www.cengagebrain.com) forecast the June 30, 2017 income statement and balance sheet for Ethan Allen. Use the percent of sales method and the following assumptions: (1) sales in FY 2017 will be $797.3359; (2) the tax rate will be 35%;(3) each item that changes with sales will be the five-year average percentage of sales; (4) net fixed assets will increase to $300; and (5) the common dividend will be $0.75 per share. Use your judgment on all other items. a. What is the discretionary financing needed in 2017? Is this a surplus or deficit? b. Assume that the DFN will be absorbed by long-term debt and that the interest rate is 4% of LTD. Set up an iterative worksheet to eliminate it. Create a chart of cash versus sales and add a trend line. Is cash a consistent percentage of sales? Does this fit your expectations? c. B D E Ethan Kulen Interiors Inc. Balance Sheet (Industrial) All figures in millions of U.S. Dollar, except per share items Jun '16 Jun '15 Jun '14 Jun '13 Jun '12 Assets Cash Only 52.659 76.182 109.176 72.601 79.721 Total Short Term Investments 0.000 2.198 18.153 15.529 9.005 Short-Term Receivables 9.467 12.547 12.426 12.277 14.919 Inventories 162.323 151.916 146.275 137.256 155.739 Other Current Assets 23.755 27.831 19.599 22.907 23.408 1 Total Current Assets 248.204 270.674 309.629 260.570 282.792 2 Property, Plant & Equipment - Gross 598.264 594.912 601.709 594.385 587.368 3 Accumulated Depreciation 324.649 317.877 313.553 302.713 291.673 4 Net Property, Plant & Equipment 273.615 277.035 288.156 291.672 295.695 5 Other Long-Term Assets 55.590 59.599 60.649 65.043 66.301 6 Total Assets 577.409 607.308 654.434 617.285 644.788 17 #8 Liabilities & Shareholders' Equity 9 ST Debt & Curr. Portion LT Debt 3.001 3.341 0,501 0.480 0.250 20 Accounts Payable 15.437 18.946 24.320 22.995 27.315 21 Other Current Liabilities 104.909 118.682 111.226 109.464 123.512 22 Total Current Liabilities 123.347 140.969 136.047 132.939 151.077 23 Long-Term Debt 38.837 74.227 130.411 130,809 154.250 24 Other Liabilities 23.02 21.522 20.509 19.180 17.593 25 Total Liabilities 185.207 236.773 286.967 282.928 322.920 26 Common Stock Pur/Carry Value 0.489 0.489 0.486 0.486 0.485 27 Additional Paid-In Capital Capital Surplus 374.972 370.914 365.733 363.938 361.165 28 Retained Earnings 646,315 607,079 584.395 553,083 542.918 29 Treasury Stock and Other Deductions from Equity 629.374 607.942 583.147 583.150 582.700 30 Total Shareholders' Equity 392.202 370.535 367.467 334.357 321,868 31 Total Liabilities & Shareholders' Equity 577.409 607.308 654.434 32 617.285 644.788 Ethan Allen Interiors Inc. Income Statement (Industrial) All figures in millions of U.S. Dollar except per share items Jun 16 Jun 15 Jun '14 Sales 794.202 754.600 746.659 Cost of Goods Sold (COGS) incl. D&A 351.966 343.437 340.163 Gross Income 442.236 411.163 406.496 SG&A Expense 353.057 345.229 336.860 EBIT (Operating Income) 89.179 65.934 69.636 Interest Expense 1618 5.957 7.540 Other Income - Net 0.395 1.206 0.306 Unusual Expense - Net 0.000 4.500 0.000 5 Pretax Income 87.956 56.683 62.402 Income Taxes 31.319 19.541 19.471 5 Net Income 56.637 37.142 42.931 6 7 8 EPS (recurring) 2.00 1.38 1.47 9 EPS (diluted) 2.00 1.27 1.47 0 Diluted Shares Outstanding 28.32 29.18 29.28 1 Total Shares Outstanding 27.75 28.41 28.93 2 Dividends per Share 0.62 0.50 0.40 23 Payout Ratio 31.00 39.37 27.21 24 25 EBITDA 108.53 85.08 87.57 26 EBIT 89.18 65.93 69.64 27 Depreciation & Amortization Expense 19.35 19.14 17.93 28 Jun '13 Jun 12 729.083 729.373 330.734 339.085 398.349 390.288 337.912 340.676 60.437 49.612 8.778 9.020 -1.485 0.562 0.000 -0,085 50.174 41.239 17.696 -8.455 32.478 49.694 1.11 29.24 28.91 0.36 32.43 1.71 1.71 29.11 28.84 0.30 17.54 68.19 78.45 60.44 18.01 49.61 18.58 Problems 1. Using the data in the student spreadsheet file Ethan Allen Financials.xlsx (to find the student spreadsheets for Financial Analysis with Microsoft Excel , eighth edition, go to www.cengagebrain.com) forecast the June 30, 2017 income statement and balance sheet for Ethan Allen. Use the percent of sales method and the following assumptions: (1) sales in FY 2017 will be $797.3359; (2) the tax rate will be 35%;(3) each item that changes with sales will be the five-year average percentage of sales; (4) net fixed assets will increase to $300; and (5) the common dividend will be $0.75 per share. Use your judgment on all other items. a. What is the discretionary financing needed in 2017? Is this a surplus or deficit? b. Assume that the DFN will be absorbed by long-term debt and that the interest rate is 4% of LTD. Set up an iterative worksheet to eliminate it. Create a chart of cash versus sales and add a trend line. Is cash a consistent percentage of sales? Does this fit your expectations? c. B D E Ethan Kulen Interiors Inc. Balance Sheet (Industrial) All figures in millions of U.S. Dollar, except per share items Jun '16 Jun '15 Jun '14 Jun '13 Jun '12 Assets Cash Only 52.659 76.182 109.176 72.601 79.721 Total Short Term Investments 0.000 2.198 18.153 15.529 9.005 Short-Term Receivables 9.467 12.547 12.426 12.277 14.919 Inventories 162.323 151.916 146.275 137.256 155.739 Other Current Assets 23.755 27.831 19.599 22.907 23.408 1 Total Current Assets 248.204 270.674 309.629 260.570 282.792 2 Property, Plant & Equipment - Gross 598.264 594.912 601.709 594.385 587.368 3 Accumulated Depreciation 324.649 317.877 313.553 302.713 291.673 4 Net Property, Plant & Equipment 273.615 277.035 288.156 291.672 295.695 5 Other Long-Term Assets 55.590 59.599 60.649 65.043 66.301 6 Total Assets 577.409 607.308 654.434 617.285 644.788 17 #8 Liabilities & Shareholders' Equity 9 ST Debt & Curr. Portion LT Debt 3.001 3.341 0,501 0.480 0.250 20 Accounts Payable 15.437 18.946 24.320 22.995 27.315 21 Other Current Liabilities 104.909 118.682 111.226 109.464 123.512 22 Total Current Liabilities 123.347 140.969 136.047 132.939 151.077 23 Long-Term Debt 38.837 74.227 130.411 130,809 154.250 24 Other Liabilities 23.02 21.522 20.509 19.180 17.593 25 Total Liabilities 185.207 236.773 286.967 282.928 322.920 26 Common Stock Pur/Carry Value 0.489 0.489 0.486 0.486 0.485 27 Additional Paid-In Capital Capital Surplus 374.972 370.914 365.733 363.938 361.165 28 Retained Earnings 646,315 607,079 584.395 553,083 542.918 29 Treasury Stock and Other Deductions from Equity 629.374 607.942 583.147 583.150 582.700 30 Total Shareholders' Equity 392.202 370.535 367.467 334.357 321,868 31 Total Liabilities & Shareholders' Equity 577.409 607.308 654.434 32 617.285 644.788 Ethan Allen Interiors Inc. Income Statement (Industrial) All figures in millions of U.S. Dollar except per share items Jun 16 Jun 15 Jun '14 Sales 794.202 754.600 746.659 Cost of Goods Sold (COGS) incl. D&A 351.966 343.437 340.163 Gross Income 442.236 411.163 406.496 SG&A Expense 353.057 345.229 336.860 EBIT (Operating Income) 89.179 65.934 69.636 Interest Expense 1618 5.957 7.540 Other Income - Net 0.395 1.206 0.306 Unusual Expense - Net 0.000 4.500 0.000 5 Pretax Income 87.956 56.683 62.402 Income Taxes 31.319 19.541 19.471 5 Net Income 56.637 37.142 42.931 6 7 8 EPS (recurring) 2.00 1.38 1.47 9 EPS (diluted) 2.00 1.27 1.47 0 Diluted Shares Outstanding 28.32 29.18 29.28 1 Total Shares Outstanding 27.75 28.41 28.93 2 Dividends per Share 0.62 0.50 0.40 23 Payout Ratio 31.00 39.37 27.21 24 25 EBITDA 108.53 85.08 87.57 26 EBIT 89.18 65.93 69.64 27 Depreciation & Amortization Expense 19.35 19.14 17.93 28 Jun '13 Jun 12 729.083 729.373 330.734 339.085 398.349 390.288 337.912 340.676 60.437 49.612 8.778 9.020 -1.485 0.562 0.000 -0,085 50.174 41.239 17.696 -8.455 32.478 49.694 1.11 29.24 28.91 0.36 32.43 1.71 1.71 29.11 28.84 0.30 17.54 68.19 78.45 60.44 18.01 49.61 18.58
Step by Step Solution
There are 3 Steps involved in it

Get step-by-step solutions from verified subject matter experts