

Question: PROBLEMS 1. Using the data in the student spreadsheet file Ethan Allen Financials.xlsx (to find the student spreadsheets for Financial Analysis with Microsoft Excel, ninth
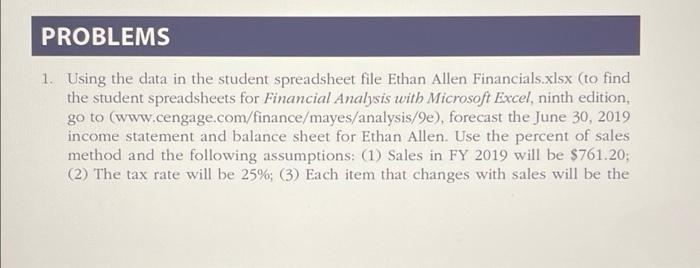
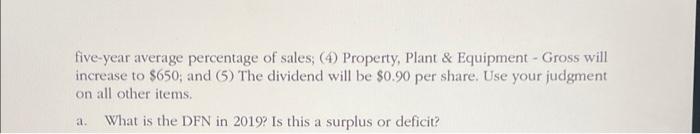
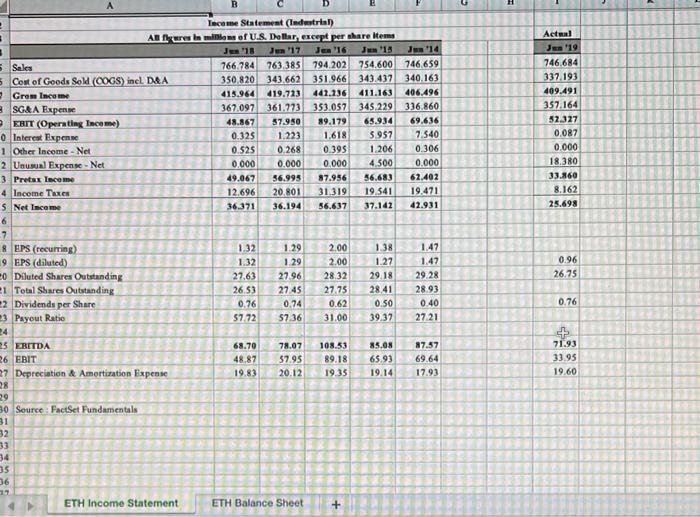
PROBLEMS 1. Using the data in the student spreadsheet file Ethan Allen Financials.xlsx (to find the student spreadsheets for Financial Analysis with Microsoft Excel, ninth edition, go to (www.cengage.com/finance/mayes/analysis/9e), forecast the June 30, 2019 income statement and balance sheet for Ethan Allen. Use the percent of sales method and the following assumptions: (1) Sales in FY 2019 will be $761.20; (2) The tax rate will be 25%; (3) Each item that changes with sales will be the five-year average percentage of sales; (4) Property, Plant & Equipment - Gross will increase to $650; and (5) The dividend will be $0.90 per share. Use your judgment on all other items. What is the DFN in 2019? Is this a surplus or deficit? Actual Tecome Statement (Industria) Andra mom of U.S. Dollar, except per share items Je '18 Jun '17 Ja '16 J '18 Sales 766,784 763,385 794.202 754.600 5 Con of Goods Sold (COGS) incl DARA 350.820 343 662 351.966 343.437 Grom Income 415.964 419.713 442.236 411.163 SG&A Expense 367.097 361.273 353.057 345,229 EBIT (Operating Income) 48.867 37.950 89.179 65.934 0 Interest Expense 0.325 1.223 1.618 5.957 1 Other Income - Net 0.525 0.268 0.395 1.206 2 Unusual Expense - Net 0.000 0.000 0.000 4.500 3 Pretax lace 49.067 56.995 87.956 56.683 4 Income Taxes 12.696 20.801 31.319 19.541 5 Net Income 36.371 36.194 56.637 37.142 6 7 & EPS (recurring) 1.32 1.29 2.00 1.38 9 EPS (diluted) 1.32 129 2.00 1.27 20 Diluted Shares Outstanding 27,63 27.96 28 32 29.18 1 Total Shares Outstanding 26.53 27.45 27.75 28.41 2 Dividende per Share 0.76 0.74 0.62 0.50 3 Payout Ratio 57.72 57.36 31.00 39.37 746.659 340.163 406.496 336.860 69.636 7.540 0.306 0.000 62.402 19,471 42.931 746.684 337.193 409.491 357.164 52.327 0.087 0.000 18.380 33.860 8.162 25.698 0.96 26.75 1.47 1.47 29.28 28.93 0.40 2721 0.76 68.70 48.87 19.83 78.07 57.95 20.12 108.53 89.18 19.35 85.08 65.93 19.14 87.57 69.64 17.93 + 71.93 33.95 19.60 25 EBITDA 26 EBIT 17 Depreciation & Amortization Expense 28 29 30 Source : FactSet Fundamentals 31 32 33 34 35 36 17 ETH Income Statement ETH Balance Sheet PROBLEMS 1. Using the data in the student spreadsheet file Ethan Allen Financials.xlsx (to find the student spreadsheets for Financial Analysis with Microsoft Excel, ninth edition, go to (www.cengage.com/finance/mayes/analysis/9e), forecast the June 30, 2019 income statement and balance sheet for Ethan Allen. Use the percent of sales method and the following assumptions: (1) Sales in FY 2019 will be $761.20; (2) The tax rate will be 25%; (3) Each item that changes with sales will be the five-year average percentage of sales; (4) Property, Plant & Equipment - Gross will increase to $650; and (5) The dividend will be $0.90 per share. Use your judgment on all other items. What is the DFN in 2019? Is this a surplus or deficit? Actual Tecome Statement (Industria) Andra mom of U.S. Dollar, except per share items Je '18 Jun '17 Ja '16 J '18 Sales 766,784 763,385 794.202 754.600 5 Con of Goods Sold (COGS) incl DARA 350.820 343 662 351.966 343.437 Grom Income 415.964 419.713 442.236 411.163 SG&A Expense 367.097 361.273 353.057 345,229 EBIT (Operating Income) 48.867 37.950 89.179 65.934 0 Interest Expense 0.325 1.223 1.618 5.957 1 Other Income - Net 0.525 0.268 0.395 1.206 2 Unusual Expense - Net 0.000 0.000 0.000 4.500 3 Pretax lace 49.067 56.995 87.956 56.683 4 Income Taxes 12.696 20.801 31.319 19.541 5 Net Income 36.371 36.194 56.637 37.142 6 7 & EPS (recurring) 1.32 1.29 2.00 1.38 9 EPS (diluted) 1.32 129 2.00 1.27 20 Diluted Shares Outstanding 27,63 27.96 28 32 29.18 1 Total Shares Outstanding 26.53 27.45 27.75 28.41 2 Dividende per Share 0.76 0.74 0.62 0.50 3 Payout Ratio 57.72 57.36 31.00 39.37 746.659 340.163 406.496 336.860 69.636 7.540 0.306 0.000 62.402 19,471 42.931 746.684 337.193 409.491 357.164 52.327 0.087 0.000 18.380 33.860 8.162 25.698 0.96 26.75 1.47 1.47 29.28 28.93 0.40 2721 0.76 68.70 48.87 19.83 78.07 57.95 20.12 108.53 89.18 19.35 85.08 65.93 19.14 87.57 69.64 17.93 + 71.93 33.95 19.60 25 EBITDA 26 EBIT 17 Depreciation & Amortization Expense 28 29 30 Source : FactSet Fundamentals 31 32 33 34 35 36 17 ETH Income Statement ETH Balance Sheet
Step by Step Solution
There are 3 Steps involved in it

Get step-by-step solutions from verified subject matter experts