

Question: Problems 2 1 . 2 . 2 . Plot in MATLAB 1 0 cycles of 1 0 0 Hz tone of amplitude 2 mm and
Problems
Plot in MATLAB cycles of Hz tone of amplitude mm and a shifted version of the same tone. Plotting in MATLAB is covered in chapter Be sure to label the axes and make everything easily readable.
Complex Exponential Notation
Section : State and Degrees of Freedom DoF of a System
Problems
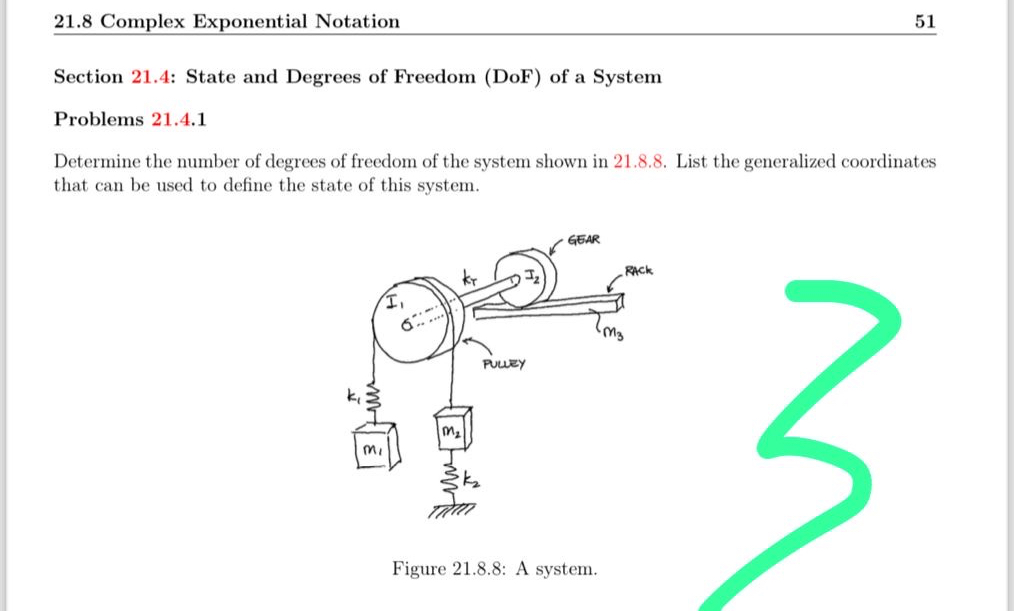
Determine the number of degrees of freedom of the system shown in List the generalized coordinates that can be used to define the state of this system.
Figure : A system.
Step by Step Solution
There are 3 Steps involved in it
1 Expert Approved Answer
Step: 1 Unlock

Question Has Been Solved by an Expert!
Get step-by-step solutions from verified subject matter experts
Step: 2 Unlock
Step: 3 Unlock