

Question: Problems Description: Your algorithm first takes an input size ( 1 0 N 2 0 , 0 0 0 ) from the user. First, your
Problems Description: Your algorithm first takes an input size N from
the user. First, your program will generate a random sequence of N integers ranging
from to and store them in an array A list in Python If N is
less than your program must use random numbers ranging from to and
print all randomly generated numbers on the screen. After generating random numbers,
your program takes an input K from the user again, and determines if there are two
numbers whose sum equals a given number K For instance, if the random numbers are
& and K is then the answer is yessince K
Do the following:
Part I: Max points
Give ON algorithm to solve this problem. Analyze the complexity of your
approach using your Python code.
Give ON log N algorithm to solve the problem Hint: Sort the array first using a
Python sort and search Analyze the complexity of your approach using your
Python code.
Give ON algorithm to solve the problem Hint: Use the given implementation of
hash table. Assume the initial size of the hash table is Describe your idea
and analyze the complexity of your approach using your Python code.
Compute the running times of three algorithms above.
Write your code in Python for ab and c
Evaluate and compare the worstcase execution times of your algorithms for
identifying pairs with sums equal to KKK over a minimum of iterations. Then,
generate a plot showing the average worstcase execution times for input sizes of
and You may adjust the input size range based on your
computer's processing speed as needed.
Make sure that you measured the worstcase execution time. An easy way to
measure the worstcase execution time is to make k greater than
Plot the averaged worstcase execution times of your ON and ON log N algorithms
for the selected input sizes in the first graph.
Plot the averaged worstcase execution times of your ON log N and ON algorithms
for the selected input sizes in the second graph.
Your graphs must show the averaged worstcase executions time on the vertical axis and
the input sizes on the horizontal axis
Part II optional up to extra points: Clearly indicate the file is for Part II
Tables presenting the ten worstcase execution time measurements
A graph showing the averaged worstcase execution times for all three collision
resolution schemes
For Python Programmers: Use PyCharm for your IDE.
Part IIOptional up to extra points
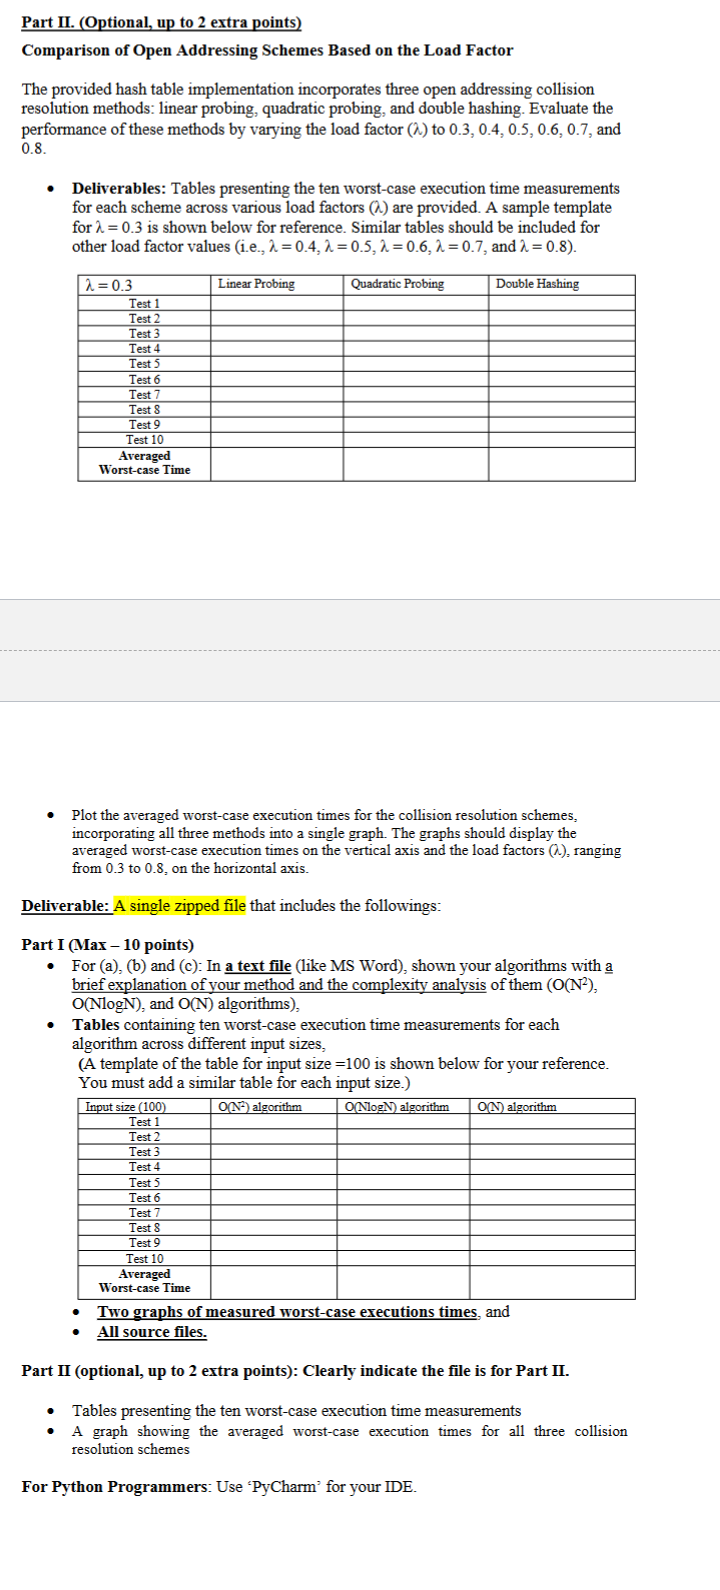
Comparison of Open Addressing Schemes Based on the Load Factor
The provided hash table implementation incorporates three open addressing collision
resolution methods: linear probing, quadratic probing, and double hashing. Evaluate the
performance of these methods by varying the load factor lambda to lambda lambda lambda lambda lambda lambda and lambda lambda
ONlogN and ON algorithms is shown below for your reference.
You must add a similar table for each input size.
Step by Step Solution
There are 3 Steps involved in it
1 Expert Approved Answer
Step: 1 Unlock

Question Has Been Solved by an Expert!
Get step-by-step solutions from verified subject matter experts
Step: 2 Unlock
Step: 3 Unlock