

Question: Problems: Show all the work clearly, for partial or full credit. Excel file should exhibit formulas. Calculate all rates to 2 decimals places in percentage.
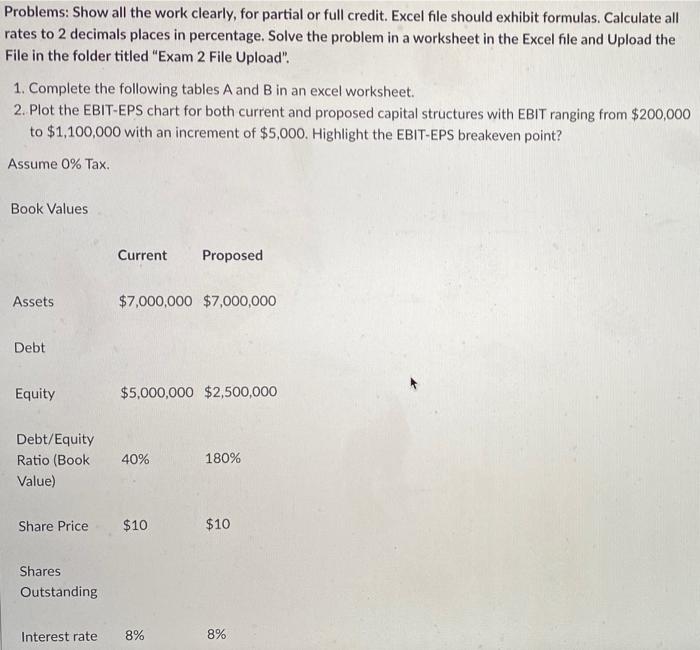
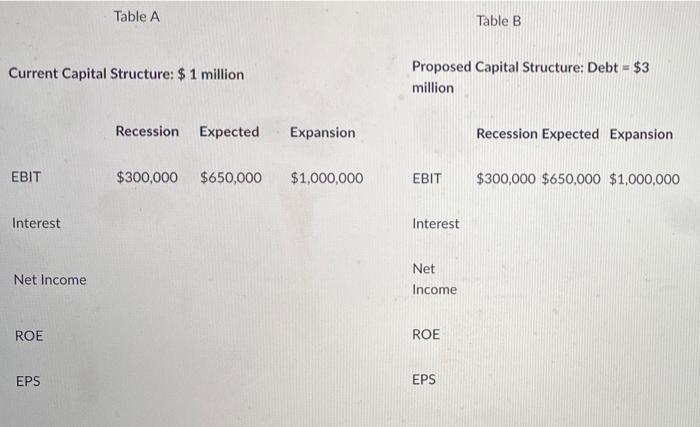
Problems: Show all the work clearly, for partial or full credit. Excel file should exhibit formulas. Calculate all rates to 2 decimals places in percentage. Solve the problem in a worksheet in the Excel file and Upload the File in the folder titled "Exam 2 File Upload". 1. Complete the following tables A and B in an excel worksheet. 2. Plot the EBIT-EPS chart for both current and proposed capital structures with EBIT ranging from $200,000 to $1,100,000 with an increment of $5,000. Highlight the EBIT-EPS breakeven point? Assume 0% Tax. Book Values Current Proposed Assets $7,000,000 $7,000,000 Debt Equity $5,000,000 $2,500,000 Debt/Equity Ratio (Book Value) 40% 180% Share Price $10 $10 Shares Outstanding Interest rate 8% 8% Table A Table B Current Capital Structure: $ 1 million Proposed Capital Structure: Debt = $3 million Recession Expected Expansion Recession Expected Expansion EBIT $300,000 $650,000 $1,000,000 EBIT $300,000 $650,000 $1,000,000 Interest Interest Net Net Income Income ROE ROE EPS EPS
Step by Step Solution
There are 3 Steps involved in it

Get step-by-step solutions from verified subject matter experts