

Question: Goal: Determine the most appropriate cost driver for predicting fuel and wage costs. Procedure: In B24, enter a function formula that determines the correlation
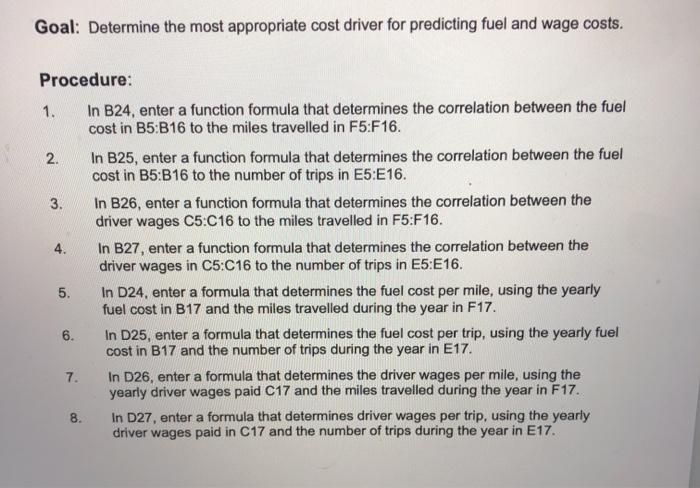
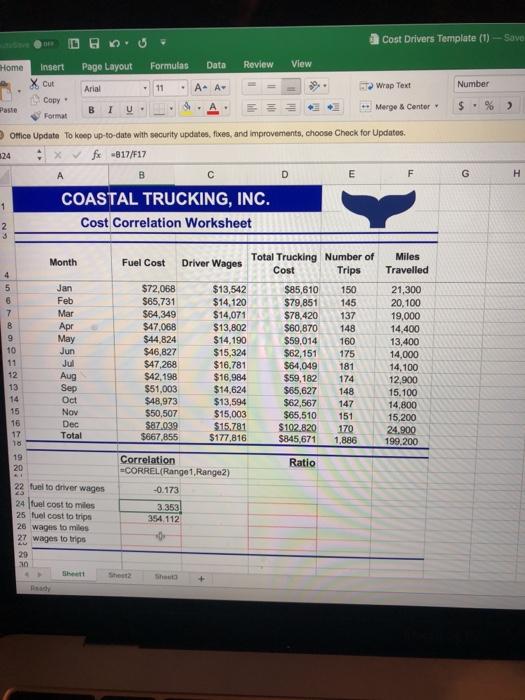
Goal: Determine the most appropriate cost driver for predicting fuel and wage costs. Procedure: In B24, enter a function formula that determines the correlation between the fuel cost in B5:B16 to the miles travelled in F5:F16. 1. 2. 3. 4. 5. 6. 7. 8. In B25, enter a function formula that determines the correlation between the fuel cost in B5:B16 to the number of trips in E5:E16. In B26, enter a function formula that determines the correlation between the driver wages C5:C16 to the miles travelled in F5:F16. In B27, enter a function formula that determines the correlation between the driver wages in C5:C16 to the number of trips in E5:E16. In D24, enter a formula that determines the fuel cost per mile, using the yearly fuel cost in B17 and the miles travelled during the year in F17. In D25, enter a formula that determines the fuel cost per trip, using the yearly fuel cost in B17 and the number of trips during the year in E17. In D26, enter a formula that determines the driver wages per mile, using the yearly driver wages paid C17 and the miles travelled during the year in F17. In D27, enter a formula that determines driver wages per trip, using the yearly driver wages paid in C17 and the number of trips during the year in E17. Home Paste 1 456TB92222222 27 3 7 8 10 11 12 13 14 Merge & Center Office Update To keep up-to-date with security updates, fixes, and improvements, choose Check for Updates. 24 Xfx 817/F17 B 15 16 17 18. 19 20 D Insert X Cut Copy Format 29 30 A Month Jan Ready Feb Mar COASTAL TRUCKING, INC. Cost Correlation Worksheet Apr May Page Layout Jun Jul Aug Sep Oct Nov Arial B IU. Dec Total 22 fuel to driver wages 24 fuel cost to miles 25 fuel cost to trips 26 wages to miles 27 wages to trips Formulas Data A- A Sheett Fuel Cost Sheet2 $72,068 $65,731 $64,349 $47,068 $44,824 $46,827 $47,268 $42,198 $51,003 $48,973 $50,507 $87.039 $667,855 -0.173 3.353 354.112 O C Shout Review Correlation CORREL(Range 1, Range2) Driver Wages $13,542 $14,120 $14,071 $13,802 $14,190 $15,324 $16,781 + $16,984 $14,624 $13,594 $15,003 $15.781 $177,816 View D E Total Trucking Number of Cost Trips $85,610 150 $79,851 145 $78,420 $60,870 $59,014 160 $62,151 175 $64,049 $59,182 $102.820 $845,671 Ratio 137 148 181 174 $65,627 148 $62,567 147 $65,510 151 170 1,886 Cost Drivers Template (1)-Save Wrap Text F Miles Travelled 21,300 20,100 19,000 14,400 13,400 14,000 14,100 12,900 15.100 14,800 15,200 24.900 199,200 Number $% G > H
Step by Step Solution
3.49 Rating (162 Votes )
There are 3 Steps involved in it
Correlation Correlation coefficient denotes the strength of the relationship between two variables I... View full answer

Get step-by-step solutions from verified subject matter experts