

Question: Process Control: p - chart Out of Control Conceptual Overview: Explore how p - charts are used to detect processes out of control. This p
Process Control: pchart Out of Control
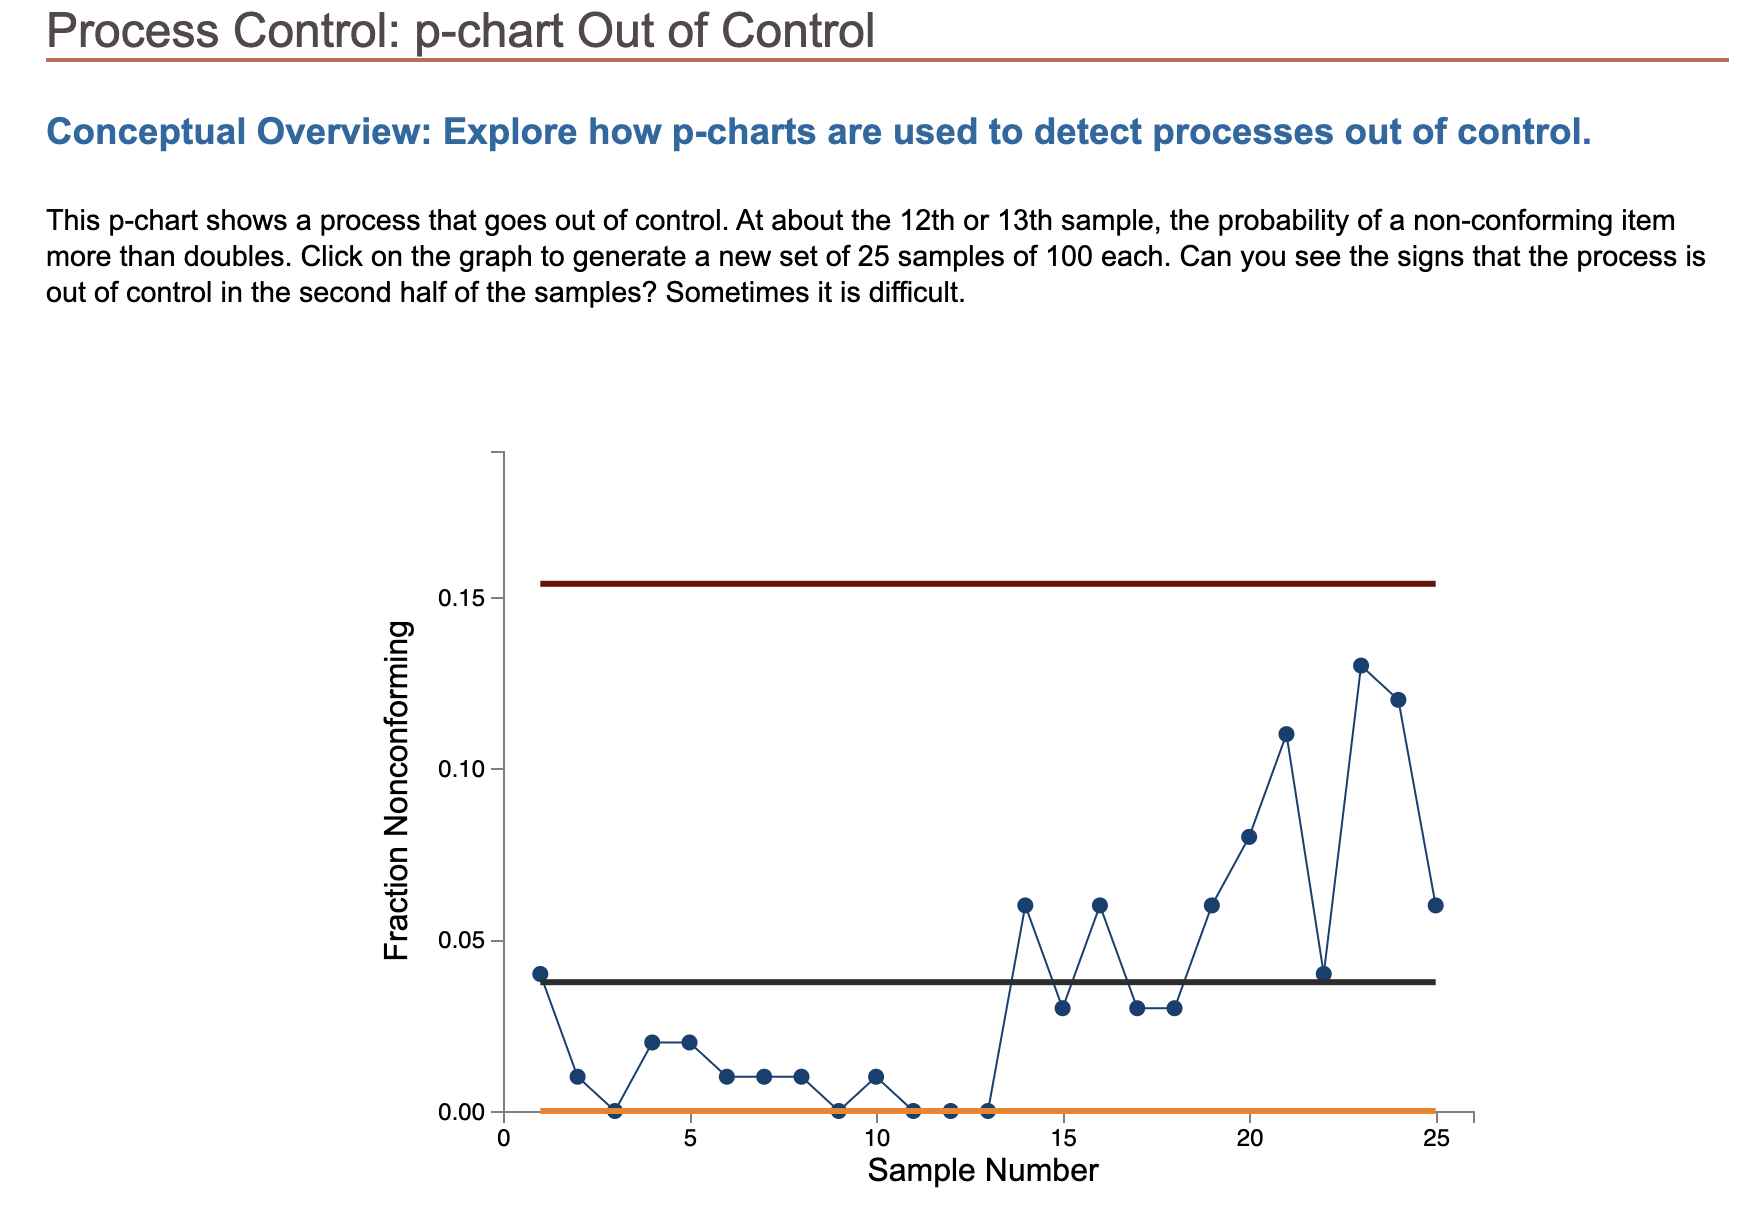
Conceptual Overview: Explore how pcharts are used to detect processes out of control.
This pchart shows a process that goes out of control. At about the th or th sample, the probability of a nonconforming item
more than doubles. Click on the graph to generate a new set of samples of each. Can you see the signs that the process is
out of control in the second half of the samples? Sometimes it is difficult.
Step by Step Solution
There are 3 Steps involved in it
1 Expert Approved Answer
Step: 1 Unlock

Question Has Been Solved by an Expert!
Get step-by-step solutions from verified subject matter experts
Step: 2 Unlock
Step: 3 Unlock