

Question: Produce a graph comparing a call's intrinsic value [defined as max(S-X,0)] and its Black-Scholes price. Stock prices to produce respective intrinsic values should start at
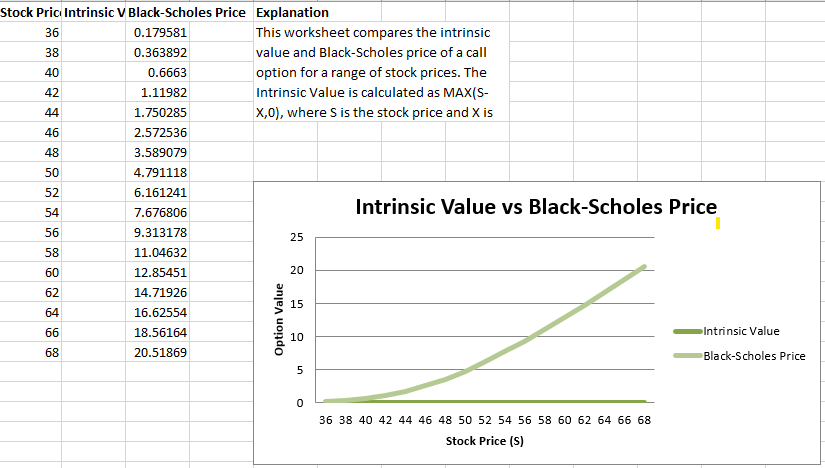
Produce a graph comparing a call's intrinsic value [defined as max(S-X,0)] and its Black-Scholes price. Stock prices to produce respective intrinsic values should start at 36 and end at 68 (units of 2). From this graph, provide an explanation of why it is never optimal to exercise early on a call priced by the Black-Scholes. Use the inputs below:
| S | 50 |
| X | 50 |
| r | 10.00% |
| T | 0.5 |
| Sigma | 25% |

Step by Step Solution
There are 3 Steps involved in it
1 Expert Approved Answer
Step: 1 Unlock

Question Has Been Solved by an Expert!
Get step-by-step solutions from verified subject matter experts
Step: 2 Unlock
Step: 3 Unlock