

Question: Production Errors Since it was established in 2002, Custom T shirts has rapidly become the place to order customized T~shirts. One huge selling factor is
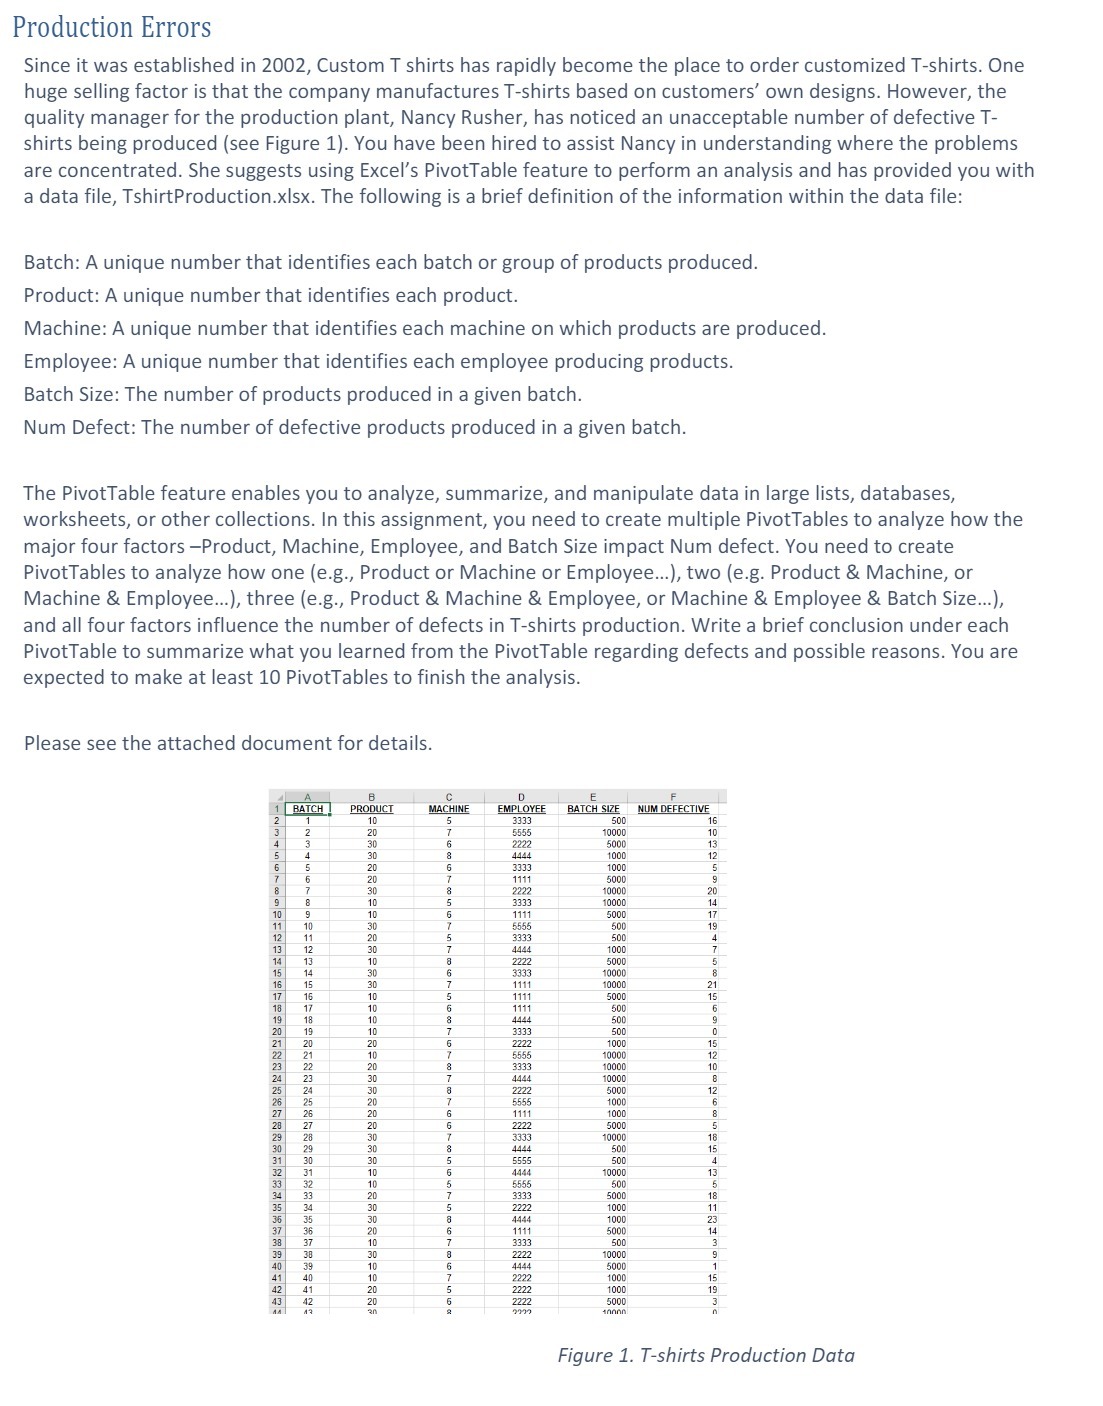
Production Errors Since it was established in 2002, Custom T shirts has rapidly become the place to order customized T~shirts. One huge selling factor is that the company manufactures T-shirts based on customers' own designs. However, the quality manager for the productiOn plant, NanCy Rusher, has noticed an unacceptable number of defective T shirts being produced (see Figure 1). You have been hired to assist Nancy in understanding where the problems are concentrated. She suggests using Excel's PivotTable feature to perform an analysis and has provided you with a data file, TshirtProduction.xlsx. The following is a brief definition ofthe information within the data file: Batch: A unique number that identifies each batch or group of products produced. Product: A unique number that identifies each product. Machine: A unique number that identifies each machine on which products are produced. Employee: A unique number that identifies each employee producing products. Batch Size: The number of products produced in a given batch. Num Defect: The number of defective products produced in a given batch. The PivotTable feature enables you to analyze, summarize, and manipulate data in large lists, databases, worksheets, or other collections. In this assignment, you need to create multiple PivotTables to analyze how the major four factors Product, Machine, Employee, and Batch Size impact Num defect. You need to create PivotTables to analyze how one (e.g., Product or Machine or Employee...), two (e.g. Product 8!. Machine, or Machine 8; Employee...}, three (e.g., Product 8r Machine 8!. Employee, or Machine 81 Employee 81. Batch Size...), and all four factors influence the number of defects in T-shirts production. Write a brief conclusion under each PivotTable to summarize what you learned from the PivotTable regarding defects and possible reasons. You are expected to make at least 10 PivotTables to finish the analysis. Please see the attached document for details. Ti." _._..__B___._.__ __ .......Q... _ .1. _._.._.Q L ._.._.._._____I_.__.__.__ E._..__.___ _1_. '1 mi _ Pnonucr 1111mm: _ EIPLm'EE 11mm 512: nun DEFECTIVE 2_ 1 _ 1n 5 333:1 _ sun 15 :1_ 2 20 r 5555 Iauun 1n 4_ 3 so 5 2222 soon 13 5 4 3|] 8 4441!. _ mall 12 _G_ 5 2|] 6 3333 lODI] 5 r 5 29 r 1111 soon 5 s_ r 30 a 2222 IUDDEI 20 i 1: 10 5 3x13 _ mar: 14 1g 9 1n 5 1111 saw: 1r 11 111 an 1' 5555 500 15 11 11 2|] 5 3133 EUR 4 E 12 _ 3|] T W lDDI] T 1-1_ 1: 1n 5 222 sum: 5 15_ 14 30 6 33:13 moon 3 E 15 _ an r 1111 _ 1mm: 21 11 1s _ 1n 5 1111 _ soon 15 15 1: 1n 5 1111 son 5 19. 15 10 a ma sun 9 a 19 _ 10 r 313:1 _ son a 21 20 29 5 10m: 15 22 21 10 r 5555 mun 12 z_3 22 20 s 3133 moan 1n 11 23 _ an 7 ma _ man a a; 21 an a 2222 soon 12 2_5_ 25 20 r 5555 won 5 a 3 2|] E 1111 mall I! a; 27 29 s 2222 saw 5 29 23 an i' 1333 10m 1s 31 29 30 8 ms. 500 15 i so an s 5555 _ sun .1 .12_ 3: 1n 5 me. man 13 33__ 52 1o 5 5555 son 5 3; 31 2|] 7 31133 _ EDDB 13 E 34 an s 2222 _ 1m 11 .15 35 an a 4m 1m 23 31 36 20 5 1111 soon 14 g :7 1n 7 3x13 sun 3 a; 31 an a 2222 moon 9 40 .19 1n 5 44-1-1 soon 1 4L 40 1o 7 2222 won 15 g 41 29 s 2222 won 15 43_ 42 20 5 2222 soon 3 ll 11'} an 9 m Ill Figure 1. Teshirts Production Data
Step by Step Solution
There are 3 Steps involved in it

Get step-by-step solutions from verified subject matter experts