

Question: Show how to do pivot tables please! Production Errors Since it was established in 2002, Custom Tshirts has rapidly become the place to order customized
Show how to do pivot tables please!
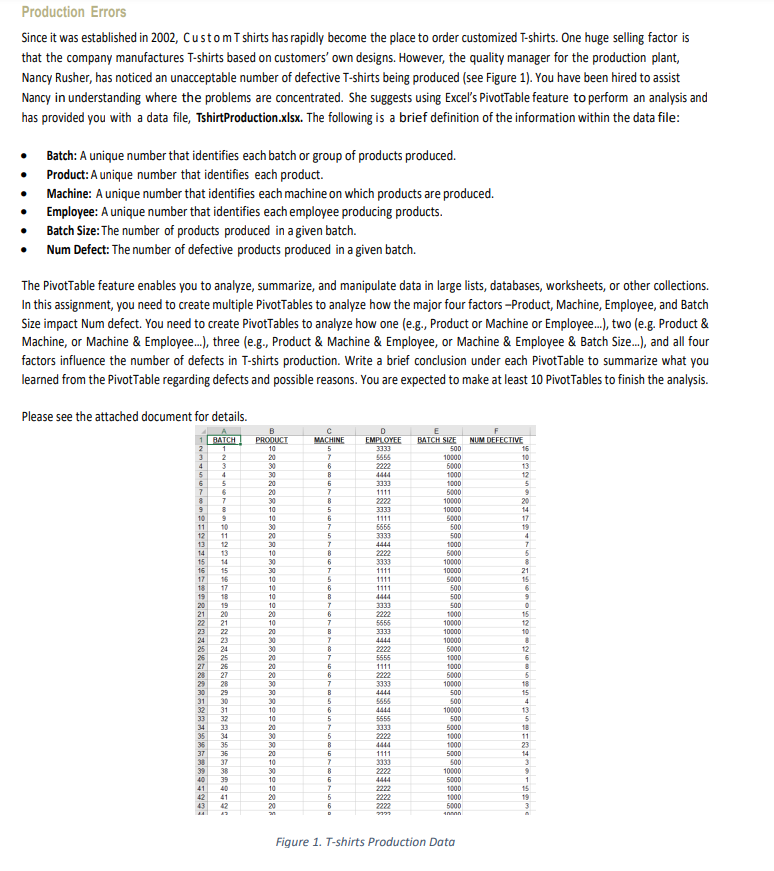
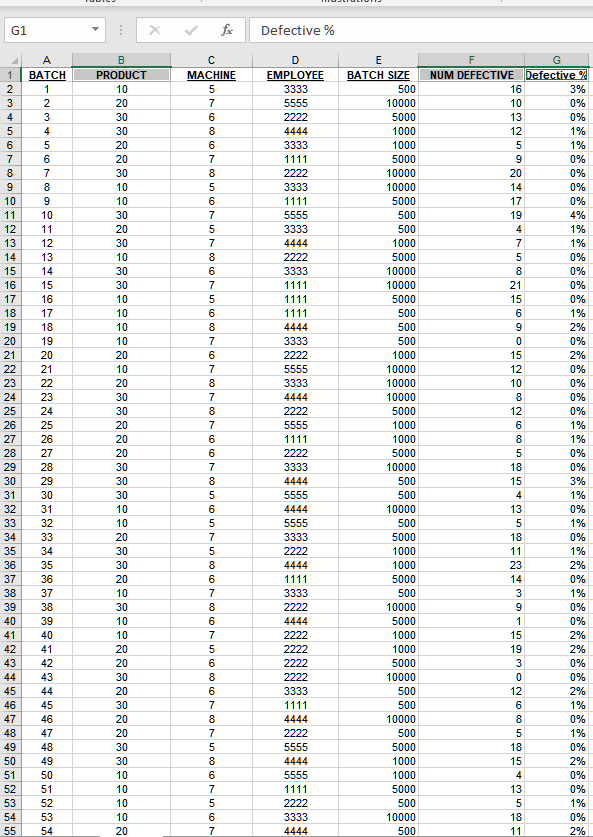
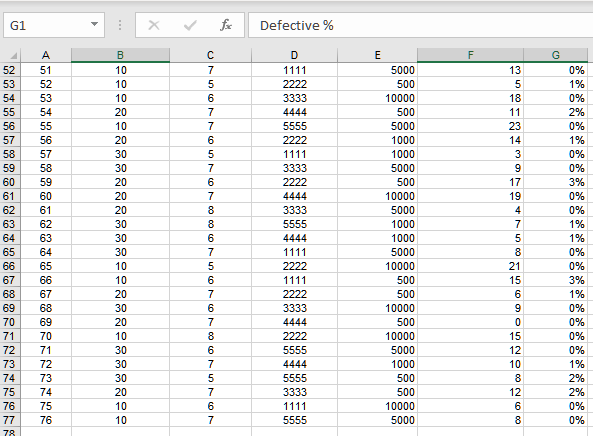
Production Errors Since it was established in 2002, Custom Tshirts has rapidly become the place to order customized T-shirts. One huge selling factor is that the company manufactures T-shirts based on customers' own designs. However, the quality manager for the production plant, Nancy Rusher, has noticed an unacceptable number of defective T-shirts being produced (see Figure 1). You have been hired to assist Nancy in understanding where the problems are concentrated. She suggests using Excel's PivotTable feature to perform an analysis and has provided you with a data file, TshirtProduction.xlsx. The following is a brief definition of the information within the data file: Batch: A unique number that identifies each batch or group of products produced. Product: A unique number that identifies each product. Machine: A unique number that identifies each machine on which products are produced. Employee: A unique number that identifies each employee producing products. Batch Size: The number of products produced in a given batch. Num Defect: The number of defective products produced in a given batch. The Pivot Table feature enables you to analyze, summarize, and manipulate data in large lists, databases, worksheets, or other collections. In this assignment, you need to create multiple PivotTables to analyze how the major four factors - Product, Machine, Employee, and Batch Size impact Num defect. You need to create PivotTables to analyze how one (e.g., Product or Machine or Employee...), two (e.g. Product & Machine, or Machine & Employee...), three (e.g., Product & Machine & Employee, or Machine & Employee & Batch Size...), and all four factors influence the number of defects in T-shirts production. Write a brief conclusion under each PivotTable to summarize what you learned from the Pivot Table regarding defects and possible reasons. You are expected to make at least 10 Pivot Tables to finish the analysis. Please see the attached document for details. BATCH MACHINE B PROOUCT 10 20 30 30 20 20 30 10 10 5 6 7 D EMPLOYEE 3333 5656 2222 4444 3333 1111 2222 3333 1111 5656 3333 NUM DEFECTIVE 15 10 13 12 5 9 10 11 12 13 14 15 16 20 14 17 19 4 7 5 8 21 15 6 9 20 30 10 30 30 10 10 10 10 29 10 20 30 2222 3333 1111 1111 1111 4444 3333 2222 5665 3330 18 19 20 21 22 23 24 25 25 27 28 29 3 4 5 6 7 8 9 10 11 12 13 1 15 16 17 18 19 20 21 22 23 24 25 26 27 28 29 30 31 32 33 34 35 35 37 38 39 40 41 42 13 7 6 8 5 7 8 5 5 7 5 7 8 6 T 5 6 B 7 6 7 B 7 8 7 6 7 B 5 6 5 7 5 8 5 7 8 6 T 5 6 15 12 10 RATCH SIZE 500 10000 5000 1000 1000 5000 10000 10000 5000 500 500 1000 5000 10000 10000 5000 500 500 500 1000 10000 10000 10000 5000 1000 1000 5000 10000 500 500 10000 500 5000 1000 1000 500D 500 10000 5000 1000 1000 5000 un 20 20 20 30 30 2222 5556 1111 2222 3333 4444 5656 31 32 4644 10 10 20 8888888888888888888888 ARRAMARROSS: 34 35 35 NARRARROSO 12 6 8 5 18 15 4 13 5 18 11 23 14 3 9 1 15 19 5555 3933 2222 4444 1111 3330 2222 4444 2222 2222 2222 30 20 10 41 10 10 43 20 Figure 1. T-shirts Production Data G1 X fac Defective % MACHINE 5 7 6 8 O ooO O oo NO CON 000 h 1 2 3 4 5 6 7 8 9 10 11 12 13 14 15 16 17 18 19 20 21 22 23 24 25 26 27 28 29 30 31 32 33 34 35 36 37 38 39 40 41 42 43 44 45 46 47 48 49 50 51 52 53 54 55 COOOOOO A BATCH 1 2 3 4 5 6 7 8 9 10 11 12 13 14 15 16 17 18 19 20 21 22 23 24 25 26 27 28 29 30 31 32 33 34 35 36 37 38 39 40 41 42 43 44 45 46 47 48 49 50 51 52 53 54 B PRODUCT 10 20 30 30 20 20 30 10 10 30 20 30 10 30 30 10 10 10 10 20 10 20 30 30 20 20 20 30 30 30 10 10 20 30 30 20 10 30 10 10 20 20 30 20 30 20 20 30 30 10 10 10 10 20 7 8 5 6 7 5 7 8 6 7 5 6 8 7 6 7 8 7 8 7 6 6 7 8 5 6 5 7 5 8 D EMPLOYEE 3333 5555 2222 4444 3333 1111 2222 3333 1111 5555 3333 4444 2222 3333 1111 1111 1111 4444 3333 2222 5555 3333 4444 2222 5555 1111 2222 3333 4444 5555 4444 5555 3333 2222 4444 1111 3333 2222 4444 2222 2222 2222 2222 3333 1111 4444 2222 5555 4444 5555 1111 2222 3333 4444 E BATCH SIZE 500 10000 5000 1000 1000 5000 10000 10000 5000 500 500 1000 5000 10000 10000 5000 500 500 500 1000 10000 10000 10000 5000 1000 1000 5000 10000 500 500 10000 500 5000 1000 1000 5000 500 10000 5000 1000 1000 5000 10000 500 500 10000 500 5000 1000 1000 5000 500 10000 500 F G NUM DEFECTIVE Defective % 16 3% 10 0% 13 0% 12 1% 1% 0% 20 0% 14 0% 0% 19 4% 1% 1% 5 0% 8 0% 21 0% 15 0% 6 1% 2% 0 0% 15 2% 0% 10 0% 0% 0% 6 1% 8 1% 0% 18 0% 15 3% 1% 0% 1% 18 0% 11 1% 23 2% 14 0% 1% 0% 0% 15 2% 19 2% 0% 0 0% 12 2% 1% 0% 5 1% 18 0% 15 2% 0% 13 0% 1% 18 0% 11 2% O oo ohh oh oo 0 Bon Ton coowcow Non con co Con Tacoch v O oo 7 8 6 7 5 O O 0 000 ch 8 7 8 7 5 8 och O co choo 7 5 6 7 G1 fx Defective % F 13 G 0% 1% 0% 2% A 51 52 53 54 55 56 57 58 59 60 61 18 11 23 14 0% 1% 0% 0% 3% 9 17 19 4 0% C 7 5 6 7 7 6 5 7 6 7 8 8 6 7 5 6 7 6 7 8 52 53 54 55 56 57 58 59 60 61 62 63 64 65 66 67 68 69 70 71 72 73 74 75 76 77 78 62 63 B 10 10 10 20 10 20 30 30 20 20 20 30 30 30 10 10 20 30 20 10 30 30 30 20 10 10 0 0 0 0 0 0 0 0 0 0 0 0 D 1111 2222 3333 4444 5555 2222 1111 3333 2222 4444 3333 5555 4444 1111 2222 1111 2222 3333 4444 2222 5555 4444 5555 3333 1111 5555 E 5000 500 10000 500 5000 1000 1000 5000 500 10000 5000 1000 1000 5000 10000 500 500 10000 500 10000 5000 1000 500 500 10000 5000 0% 1% 1% 0% 0% 3% CO O CONTO co con 21 15 64 65 66 67 68 69 70 71 72 73 74 75 76 1% 7 5 7 6 7 15 12 10 8 12 0% 0% 0% 0% 1% 2% 2% 0% 0%Step by Step Solution
There are 3 Steps involved in it
1 Expert Approved Answer
Step: 1 Unlock

Question Has Been Solved by an Expert!
Get step-by-step solutions from verified subject matter experts
Step: 2 Unlock
Step: 3 Unlock