

Question: Production Total Total Total Total Cost | Average Average Average Marginal Product Fixed Cost | variable fixed cost | variable Total Cost | Cost cost
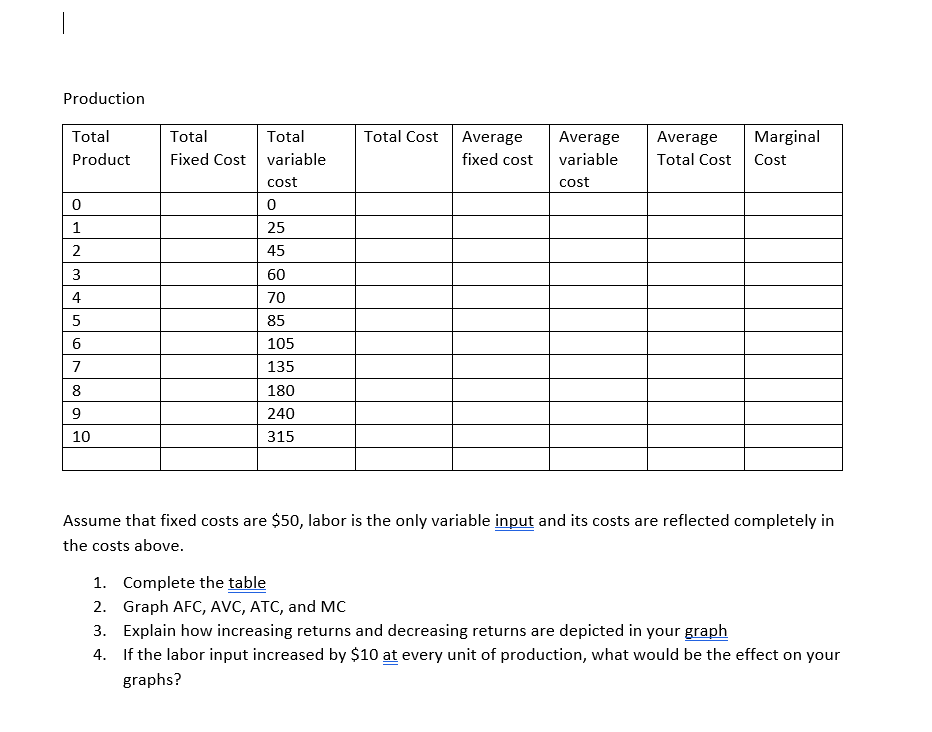
Production Total Total Total Total Cost | Average Average Average Marginal Product Fixed Cost | variable fixed cost | variable Total Cost | Cost cost cost 0 0 1 25 2 3 4 5 6 7 135 3 130 9 240 10 315 Assume that fixed costs are $50, labor is the only variable input and its costs are reflected completely in the costs above. Complete the table Graph AFC, AVC, ATC, and MC Explain how increasing returns and decreasing returns are depicted in your graph el S If the labor input increased by $10 at every unit of production, what would be the effect on your graphs
Step by Step Solution
There are 3 Steps involved in it
1 Expert Approved Answer
Step: 1 Unlock

Question Has Been Solved by an Expert!
Get step-by-step solutions from verified subject matter experts
Step: 2 Unlock
Step: 3 Unlock