

Question: 1.First, complete the below table from the data given. 2-a)At which output level is AFC at its lowest?At which output level is AVC at its
1.First, complete the below table from the data given.
2-a)At which output level is AFC at its lowest?At which output level is AVC at its lowest?At
which output level is ATC at its lowest?And, finally, at which output level is marginal cost
(MC) at its lowest?
2-b)Plot the following for each output level on same graph: (all costs plotted on same vertical axis)
1.Total fixed cost
2.Total variable cost
3.Total cost
2-c)Plot the following for each output level on same graph:(all costs plotted on same vertical axis)
1.Average fixed cost(AFC)
2.Average variable cost(AVC)
3.Average total cost(ATC)
4.Marginal cost (MC)
2-d)Explain the shape of AFC, AVC, ATC and MC curves.
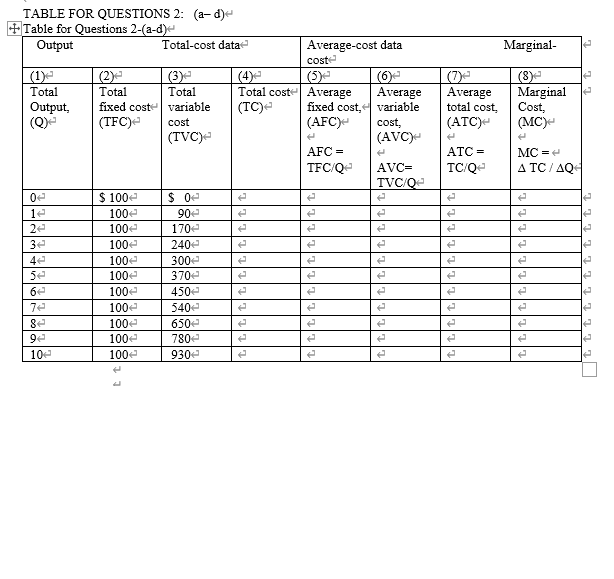
TABLE FOR QUESTIONS 2: (a-d)+ + Table for Questions 2-(a-d)+ Output Total-cost data Average-cost data Marginal- cost (1)- (2)- (3)+ (4 ) (5)+ (6)- (7)+ (8) Total Total Total Total cost Average Average Average Marginal Output, fixed cost variable (TO)+ fixed cost, + variable total cost, Cost. (Q)- (TFC)+ cost (AFC) cost, (ATC) (MC) (TVC) (AVO) AFC = ATC = MC = 4 TFC/Q- AVC= TC/Q- A TC/AQ TVC/OF $ 1004 $ OF 1004 904 1004 1704 LLLLT 1004 2406 1004 3004 1004 370 1004 450 LL L LLLLLL LL LL LL LL L L LL LLLLLL 1004 540+ LLLLLL 1006 6504 1004 7804 104 1004
Step by Step Solution
There are 3 Steps involved in it

Get step-by-step solutions from verified subject matter experts