

Question: Productivity may be measured either on aggregate busis or on individual basis, which are called total and partial measure. Total productivity Index/measure = Total output/Total
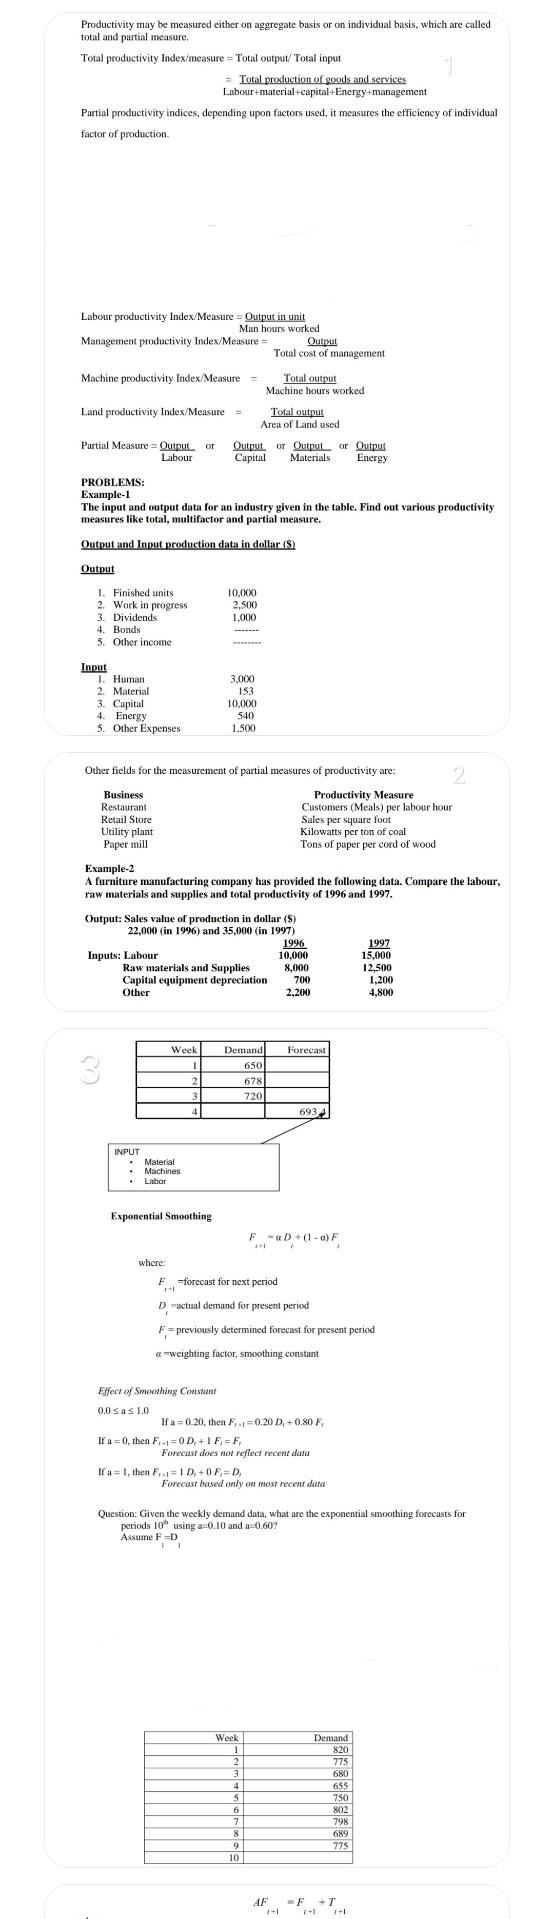
Productivity may be measured either on aggregate busis or on individual basis, which are called total and partial measure. Total productivity Index/measure = Total output/Total input = Total production of goods and services Labour material capital Energy management Partial productivity indices, depending upon factors used, it measures the efficiency of individual factor of production Labour productivity Index/Measure = Output in unit Man hours worked Management productivity Index/Measure = Output Total cost of management Machine productivity Index/Measure Total output Machine hours worked Total output Area of Land used Land productivity Index/Measure = Partial Measure = Output or Labour Output or Output or Output Capital Materials Energy PROBLEMS: Example-1 The input and output data for an industry given in the table. Find out various productivity measures like total, multifactor and partial measure. Output and Input production data in dollar ($) Output 1. Finished units 2. Work in progress 3. Dividends 4. Bonds 5. Other income 10,000 2.500 1.000 Input 1. Human 2. Material 3. Capital 4. Energy 5. Other Expenses 3.000 153 10,000 540 1.500 Other fields for the measurement of partial measures of productivity are: 2 Business Productivity Measure Restaurant Customers (Meals) per labour hour Retail Store Sales per square foot Utility plant Kilowatts per ton of coal Paper mill Tons of paper per cord of wood Example-2 A furniture manufacturing company has provided the following data. Compare the labour, raw materials and supplies and total productivity of 1996 and 1997. Output: Sales value of production in dollar ($) 22,000 (in 1996) and 35,000 (in 1997) 1996 1997 Inputs: Labour 10,000 15,000 Raw materials and Supplies 8,000 12,500 Capital equipment depreciation 70 1.200 Other 2,200 4.800 700) Forecast Week 1 Demand 650 678 720 2 3 2 4 6934 INPUT Material Machines Labor Exponential Smoothing F-a D +(-a) F where: F =forecast for next period actual demand for present period F=previously determined forecast for present period a-weighting factor, smoothing constant Effect of Smoothing Constant 0.0 Sas 1.0 If a=0.20, then F.0.20 D,+0.80 F If a=0 then F-1=0D + 1 F,=F Forecast does not reflect recent data If a = 1, then F:=1 D, +0F =D Forecast based only on most recent data Question: Given the weekly demand data, what are the exponential smoothing forecasts for periods 10 using a 0.10 and a 0.60 Assume F =D Week 1 2 3 4 4 S 6. 7 8 9 10 Demand 820 775 680 655 750 802 798 689 775 AF 2+1 -F +T - 1+
Step by Step Solution
There are 3 Steps involved in it
1 Expert Approved Answer
Step: 1 Unlock

Question Has Been Solved by an Expert!
Get step-by-step solutions from verified subject matter experts
Step: 2 Unlock
Step: 3 Unlock