

Question: Program an Excel Spreadsheet to complete a Fixed Payment Loan Amortization Schedule based on the 5 inputs (see 1a below). This spreadsheet should work for
 Program an Excel Spreadsheet to complete a Fixed Payment Loan Amortization Schedule based on the 5 inputs (see 1a below). This spreadsheet should work for any scenario chosen using the 5 inputs below that does not exceed 360 periods. You may start with any 5 inputs as these will be changed multiple times during grading. All cells with number format should have no decimal places. All cells with accounting format should have 2 decimal places. All cells with percentage format should have 3 decimal places. Formulas must use appropriate cell addressing and be efficiently copied to complete the schedule. Every number within the spreadsheet must be positive. If you are given a template, you must use the given template and follow the directions within the template.
The required part of this assignment is All of Objective I: Building a basic amortization schedule. The spreadsheet should have the following characteristics in a logical order: Objective I: Building a basic amortization schedule
1. A data table must appear at the top left that includes: a. Inputs for: Purchase Price accounting format Down Payment accounting format Number of Years number format Compounding periods per year number format Annual Interest Rate percentage format b. Formulas for: Principle accounting format Payment accounting format
2. A summarization table must appear at the top right that includes: a. Formulas for: Total Amount Paid accounting format Total Interest Paid accounting format
3. An amortization table able to accommodate any scenario must appear at the bottom containing 6 columns and 360 rows of numbers and formulas with the following titles: a. Period Number number format b. Beginning Balance accounting format, dollar sign in first row only c. Payment accounting format, dollar sign in first row only d. Interest accounting format, dollar sign in first row only e. Principle Repaid accounting format, dollar sign in first row only f. Ending Balance accounting format, dollar sign in first row only
4. Using logic and the Excel capabilities, format the spreadsheet as follows. When a number of periods smaller than 360 are required, all rows below the last significant row must be blank (i.e. no rows visible beyond the total number of periods, no negative or extremely large and unnecessary numbers).
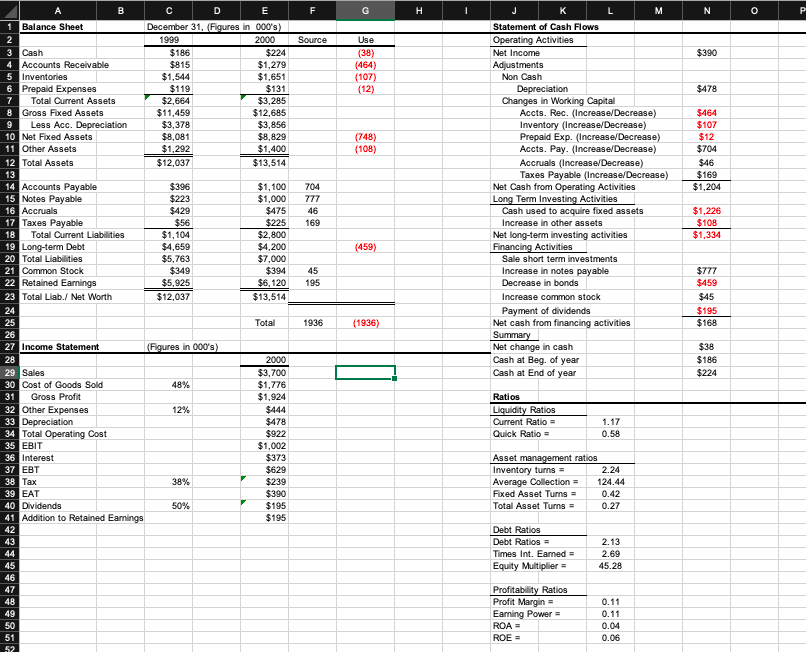
F G H I N 0 P Source $390 Use (38) (464) (107) (12) $131 $478 (748) (108) $464 $107 $12 $704 $46 $169 $1,204 704 777 46 169 J K L M Statement of Cash Flows Operating Activities Net Income Adjustments Non Cash Depreciation Changes in Working Capital Accts. Rec. (Increase/Decrease) Inventory (Increase/Decrease) Prepaid Exp. (Increase/Decrease) Accts. Pay. (Increase/Decrease) Accruals (Increase/Decrease) Taxes Payable (Increase/Decrease) Net Cash from Operating Activities Long Term Investing Activities Cash used to acquire fixed assets Increase in other assets Net long-term investing activities Financing Activities Sale short term investments Increase in notes payable Decrease in bonds Increase common stock Payment of dividends Net cash from financing activities Summary Net change in cash Cash at Beg. of year Cash at End of year $1,226 $108 $1,334 (459) 45 195 $777 $459 $45 $195 $168 A B C D E 1 Balance Sheet December 31, (Figures in 000's) 2 1999 2000 3 Cash $186 $224 4 Accounts Receivable $815 $1,279 5 Inventories $1,544 $1,651 6 Prepaid Expenses $119 7 Total Current Assets $2,664 $3,285 8 Gross Fixed Assets $11,459 $12,685 9 Less Acc. Depreciation $3,378 $3,856 10 Net Fixed Assets $8,081 $8.829 11 Other Assets $1,292 $1,400 12 Total Assets $12,037 $13,514 13 14 Accounts Payable $396 $1,100 15 Notes Payable $223 $1,000 16 Accruals $429 $475 17 Taxes Payable $56 $225 18 Total Current Liabilities $1,104 $2,800 19 Long-term Debt $4,659 $4,200 20 Total Liabilities $5.763 $7,000 21 Common Stock $349 $394 22 Retained Earnings $5,925 $6,120 23 Total Liab./ Net Worth $12,037 $13,514 24 25 Total 26 27 Income Statement (Figures in 000's) 28 2000 29 Sales $3,700 30 Cost of Goods Sold 48% $1,776 31 Gross Profit $1,924 32 Other Expenses 12% $444 33 Depreciation $478 34 Total Operating cost $922 35 EBIT $1,002 36 Interest $373 37 EBT $629 38 Tax 38% $239 39 EAT $390 40 Dividends 50% $195 41 Addition to Retained Earnings $195 42 43 44 45 46 47 48 49 50 51 52 1936 (1936) $38 $186 $224 Ratios Liquidity Ratios Current Ratio Quick Ratio = 1.17 0.58 Asset management ratios Inventory turns = 2.24 Average Collection 124.44 Fixed Asset Turns 0.42 Total Asset Turns = 0.27 Debt Ratios Debt Ratios = Times Int. Earned Equity Multiplier 2.13 2.69 45.28 Profitability Ratios Profit Margin- Earning Power = ROA= ROE = 0.11 0.11 0.04 0.06 F G H I N 0 P Source $390 Use (38) (464) (107) (12) $131 $478 (748) (108) $464 $107 $12 $704 $46 $169 $1,204 704 777 46 169 J K L M Statement of Cash Flows Operating Activities Net Income Adjustments Non Cash Depreciation Changes in Working Capital Accts. Rec. (Increase/Decrease) Inventory (Increase/Decrease) Prepaid Exp. (Increase/Decrease) Accts. Pay. (Increase/Decrease) Accruals (Increase/Decrease) Taxes Payable (Increase/Decrease) Net Cash from Operating Activities Long Term Investing Activities Cash used to acquire fixed assets Increase in other assets Net long-term investing activities Financing Activities Sale short term investments Increase in notes payable Decrease in bonds Increase common stock Payment of dividends Net cash from financing activities Summary Net change in cash Cash at Beg. of year Cash at End of year $1,226 $108 $1,334 (459) 45 195 $777 $459 $45 $195 $168 A B C D E 1 Balance Sheet December 31, (Figures in 000's) 2 1999 2000 3 Cash $186 $224 4 Accounts Receivable $815 $1,279 5 Inventories $1,544 $1,651 6 Prepaid Expenses $119 7 Total Current Assets $2,664 $3,285 8 Gross Fixed Assets $11,459 $12,685 9 Less Acc. Depreciation $3,378 $3,856 10 Net Fixed Assets $8,081 $8.829 11 Other Assets $1,292 $1,400 12 Total Assets $12,037 $13,514 13 14 Accounts Payable $396 $1,100 15 Notes Payable $223 $1,000 16 Accruals $429 $475 17 Taxes Payable $56 $225 18 Total Current Liabilities $1,104 $2,800 19 Long-term Debt $4,659 $4,200 20 Total Liabilities $5.763 $7,000 21 Common Stock $349 $394 22 Retained Earnings $5,925 $6,120 23 Total Liab./ Net Worth $12,037 $13,514 24 25 Total 26 27 Income Statement (Figures in 000's) 28 2000 29 Sales $3,700 30 Cost of Goods Sold 48% $1,776 31 Gross Profit $1,924 32 Other Expenses 12% $444 33 Depreciation $478 34 Total Operating cost $922 35 EBIT $1,002 36 Interest $373 37 EBT $629 38 Tax 38% $239 39 EAT $390 40 Dividends 50% $195 41 Addition to Retained Earnings $195 42 43 44 45 46 47 48 49 50 51 52 1936 (1936) $38 $186 $224 Ratios Liquidity Ratios Current Ratio Quick Ratio = 1.17 0.58 Asset management ratios Inventory turns = 2.24 Average Collection 124.44 Fixed Asset Turns 0.42 Total Asset Turns = 0.27 Debt Ratios Debt Ratios = Times Int. Earned Equity Multiplier 2.13 2.69 45.28 Profitability Ratios Profit Margin- Earning Power = ROA= ROE = 0.11 0.11 0.04 0.06
Step by Step Solution
There are 3 Steps involved in it

Get step-by-step solutions from verified subject matter experts